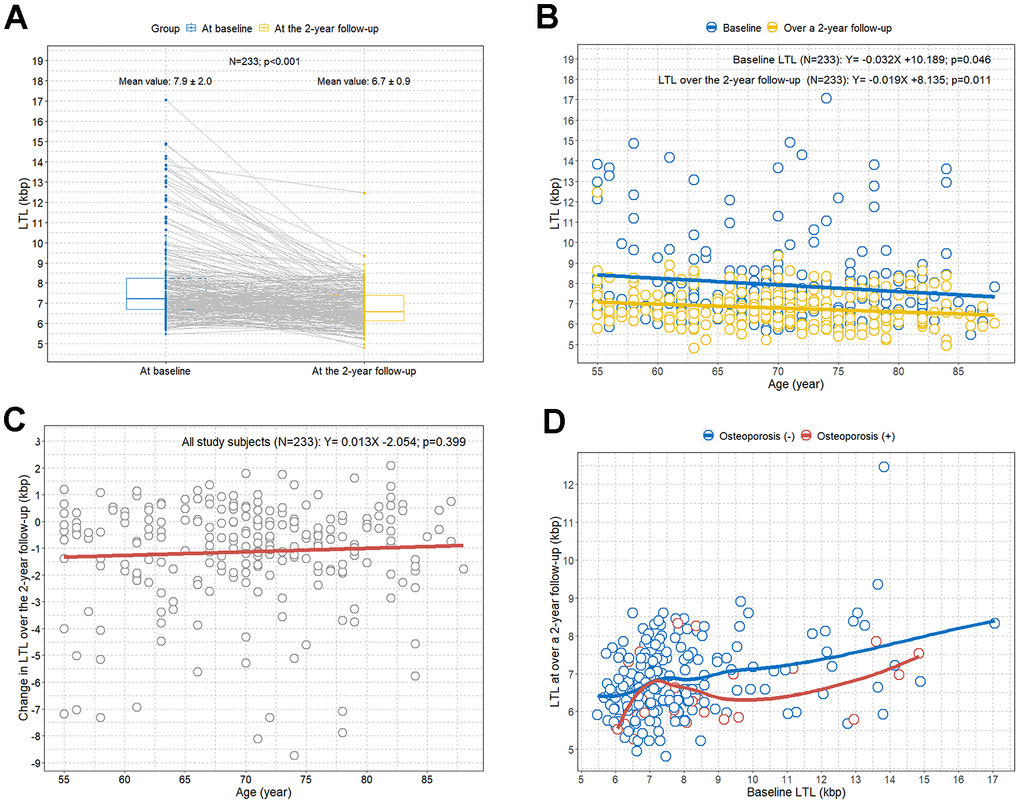
Figure 2.Comparison of LTL values between baseline and at the 2-year follow-up by age and osteoporosis. (A) Paired comparison of LTL values between at baseline (in blue) and at the 2-year follow-up (in yellow) for each study participant; (B) scatterplot with linear regression lines showing the associations between age and LTL; (C) scatterplot with linear regression line showing the association between age and change in LTL over a 2-year follow-up; (D) scatterplot with LOWESS curves showing the trend between baseline LTL and LTL at the 2-year follow-up according to osteoporosis. LOWESS, locally weighted scatter plot smoothing; LTL, leukocyte telomere length.