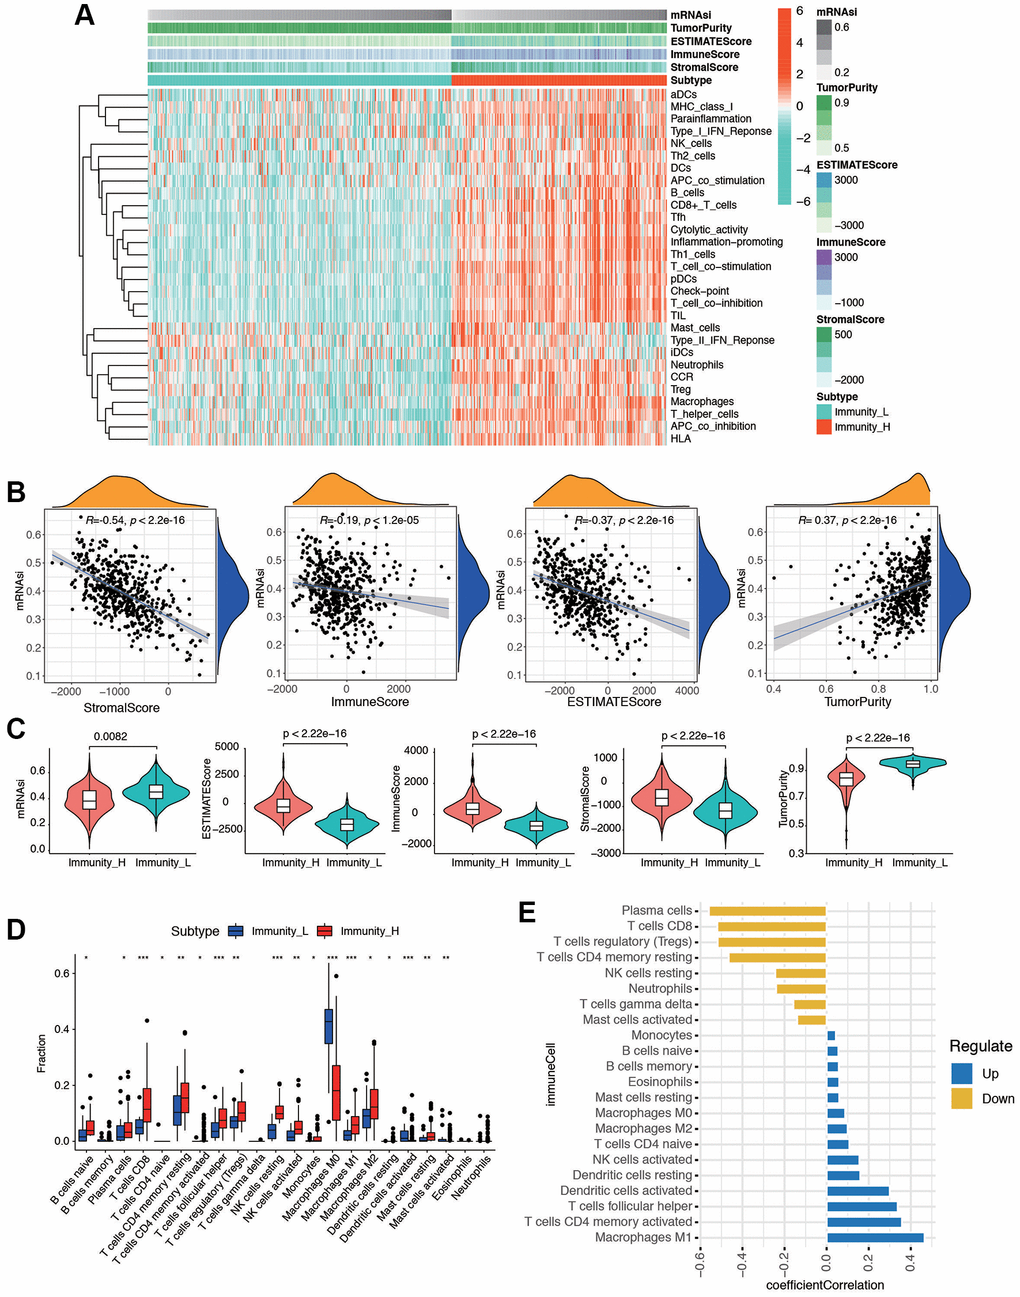
Figure 2.The tumor immune microenvironment patterns and immunogenomic features of EC associated with the mRNAsi. (A) The immune cells were highly expressed in the cluster 1, which was named as the high immune cell infiltration group (Immunity_H), and the low expression in the cluster 2 group was named as the low immune cell infiltration group (Immunity_L). Using ESTIMATE's algorithm, the tumor purity, ESTIMATE score, immune score, and stromal score of each sample gene was displayed together with the grouping information. (B) Correlation analysis between mRNAsi and different kinds of score, including stromal score, immune score, ESTIMATE score, and tumor purity. (C) The violin plot showed that there was a statistical difference in Tumor Purity, ESTIMATE Score, Immune Score and Stromal Score between the two groups (p < 0.01). (D) Different distributions of tumor-infiltrating cells in two immunity clusters (***p < 0.001, **p < 0.01, *p < 0.05). (E) Correlation analysis between immune cells and mRNAsi. Blue bars meant correlation coefficient >0, and yellow bars meant correlation coefficient <0.