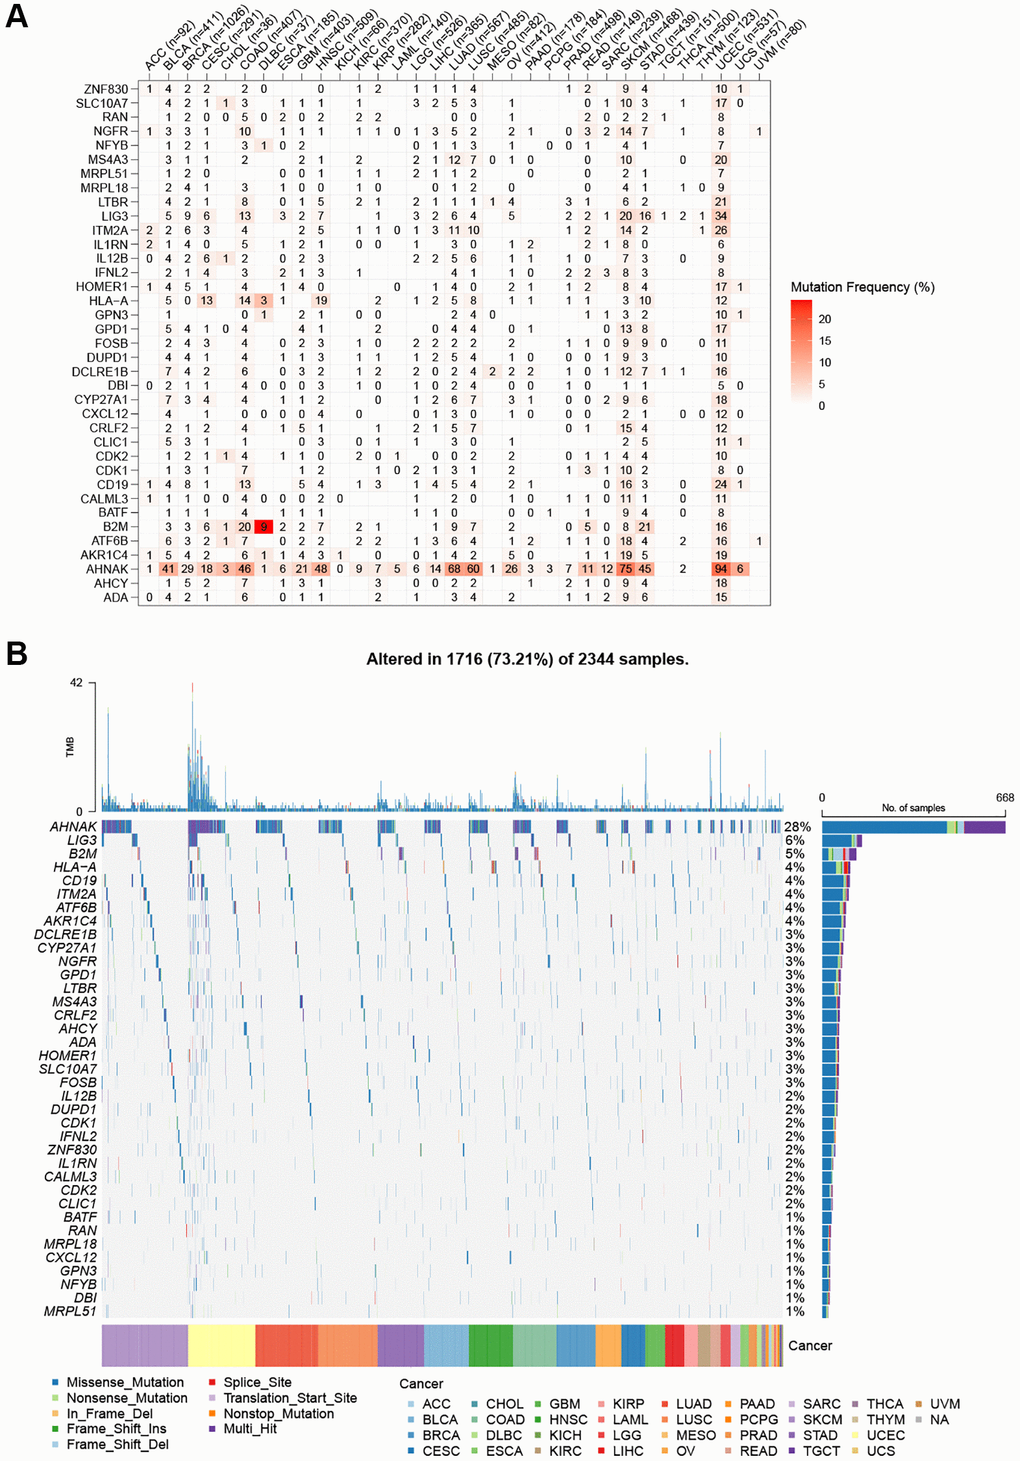
Figure 2.SNV frequency and variant types of T cell proliferation regulatory genes. (A) Mutation frequency of T cell proliferation regulatory genes. (B) SNV oncoplot. An oncoplot showing the mutation distribution of T cell proliferation regulatory genes and a classification of SNV types.