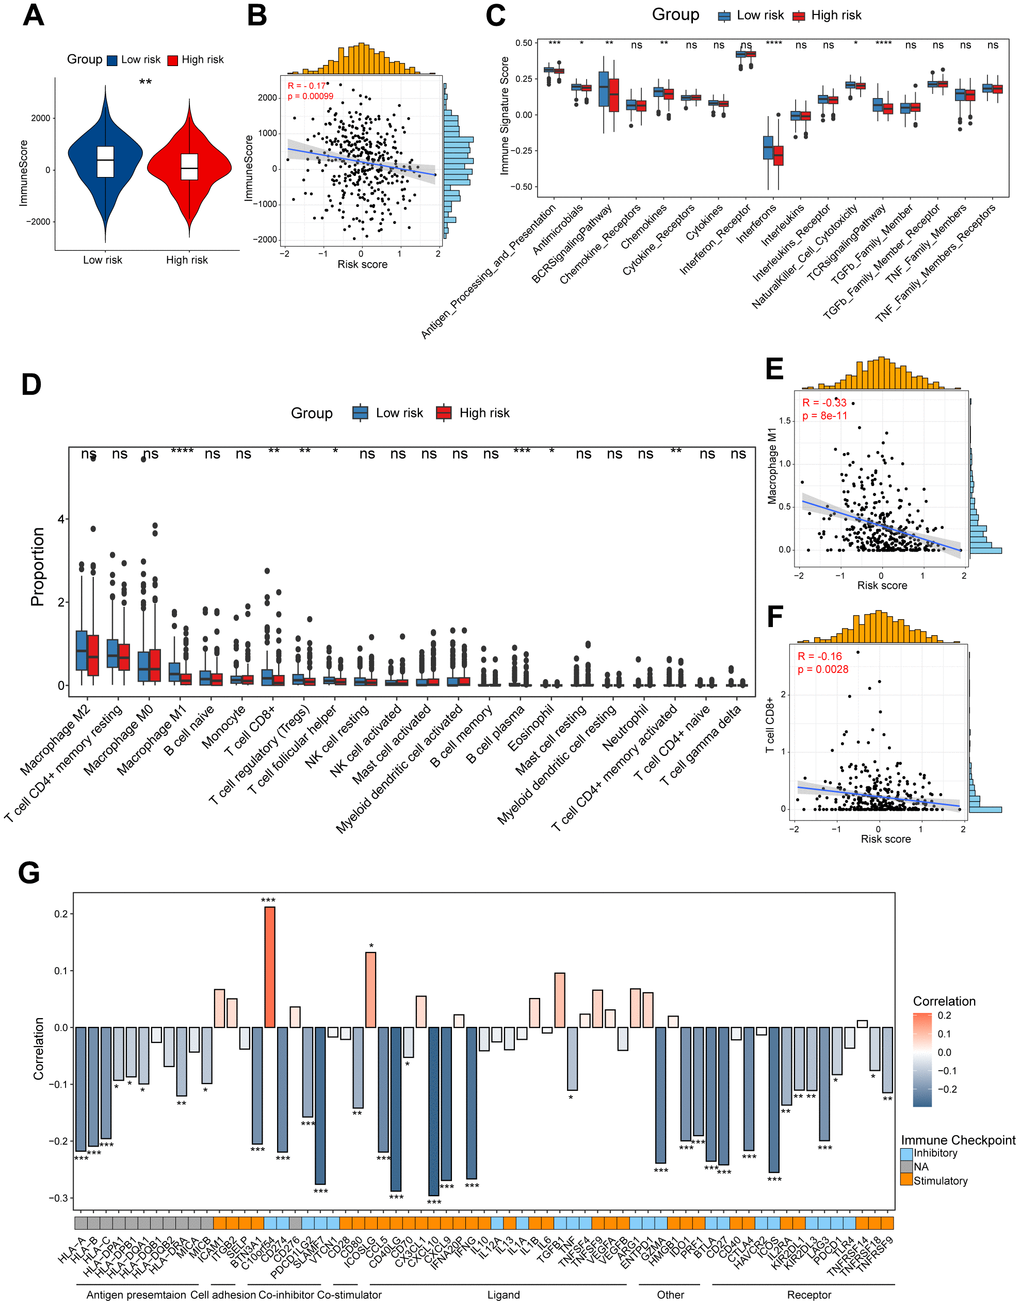
Figure 4.Dissection of tumor immune microenvironment features based on CD8+ T cell-related prognostic signature. (A) Immune score in high/low-risk groups. (B) Spearman correlation between Immune score and risk score. (C) Boxplots showing the signature score of 17 immune pathways in high/low-risk groups of ovarian cancer scored by GSVA. Paired two-sided Wilcoxon test. (D) Boxplots showing the proportion of 22 immune cells in high/low-risk groups of ovarian cancer estimated by CIBERSORT. Paired two-sided Wilcoxon test. (E, F) Scatter plots showing the correlation between the risk score and the proportion of M1-like macrophages and CD8+ T cells (G) Bar plot of the correlation between immunomodulators and the risk score. The asterisks represent the statistical P-value (*p<0.05; **p<0.01; ***p < .001; ****p < 0.0001; ns p>0.05).