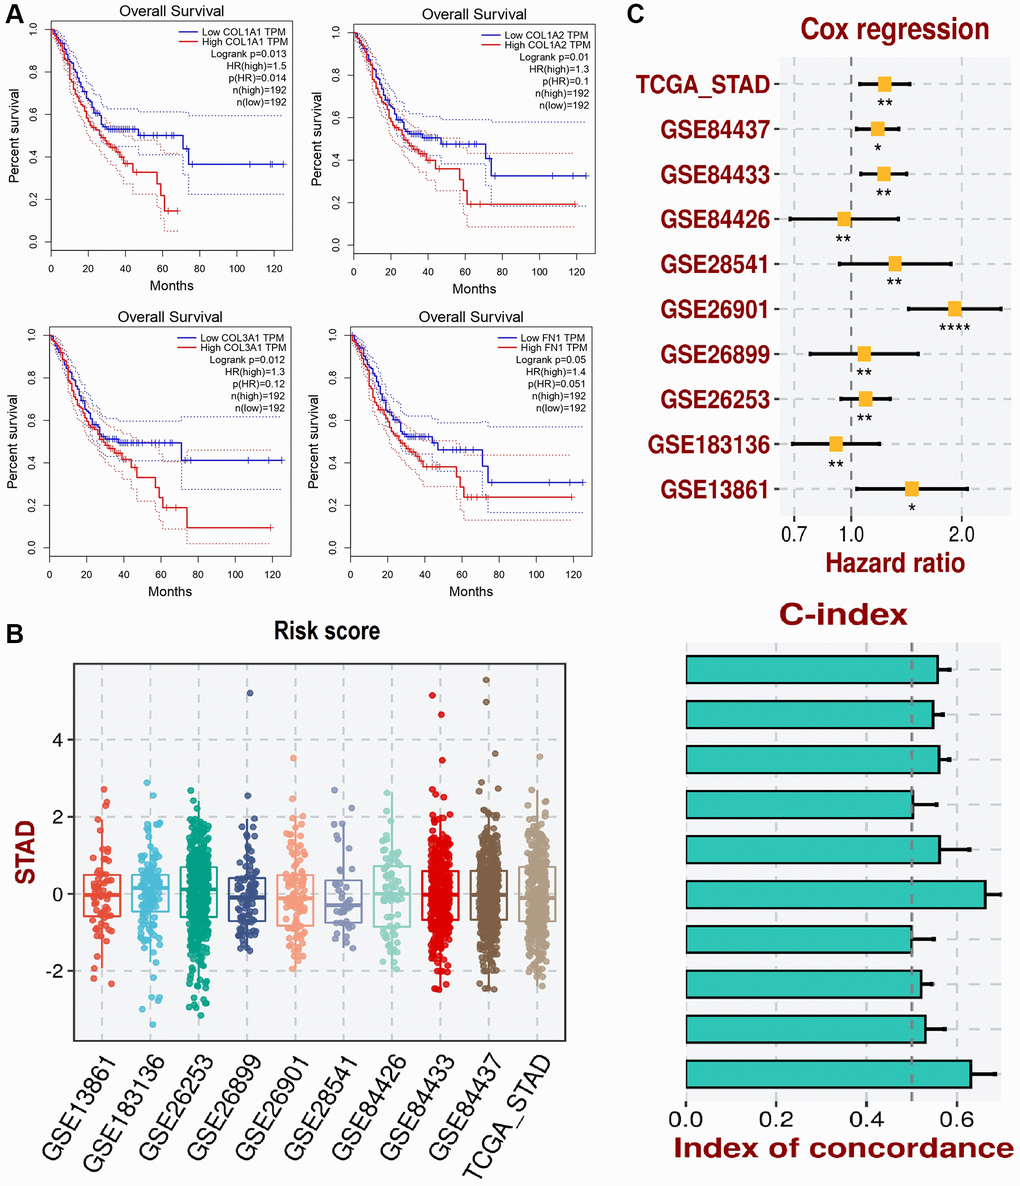
Figure 8.This figure illustrates the survival analysis and development of a prognostic model using the gene expression data of COL1A1, COL1A2, COL3A1, and FN1. (A) The survival analysis of these genes in gastric cancer (GC) patients is conducted via GEPIA. (B) Box plots representing the risk scores of patients in various GEO datasets and the TCGA_STAD dataset. (C) Cox regression analysis forest plot showing the hazard ratios of COL1A1, COL1A2, COL3A1, and FN gene expression levels for overall survival in STAD across different datasets and concordance index (C-index) bar plot for the predictive performance of the COL1A1, COL1A2, COL3A1, and FN gene expression models. The yellow squares represent the hazard ratio (HR) for each dataset with 95% confidence intervals. P-value < 0.05.