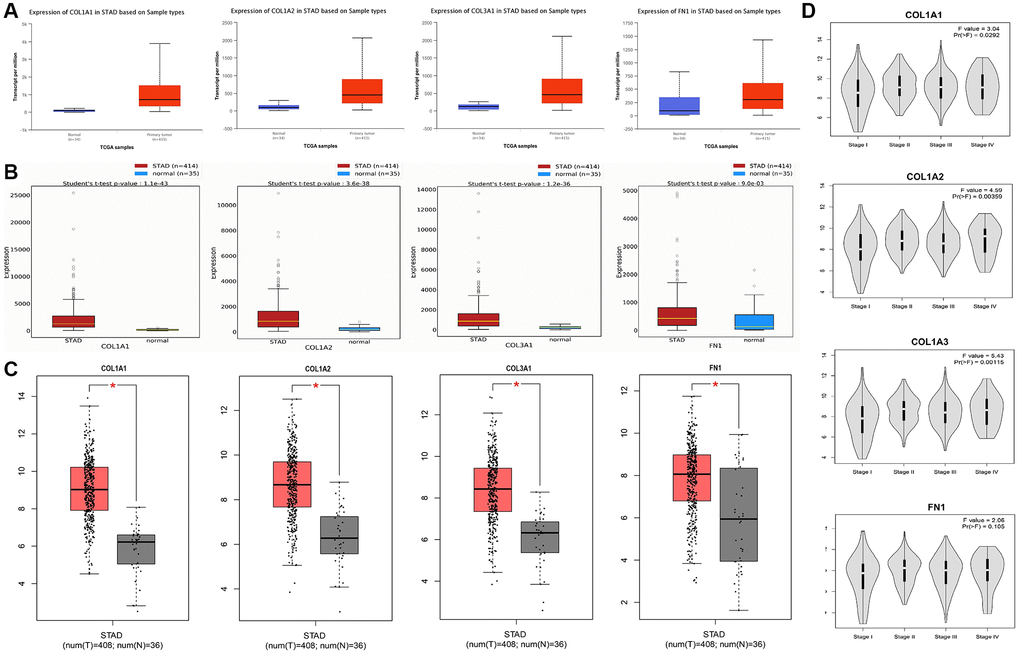
Figure 4.mRNA expression analysis of COL1A1, COL1A2, COL3A1, and FN1 using additional TCGA datasets of gastric cancer (GC). (A) Expression analysis of COL1A1, COL1A2, COL3A1, and FN1 in GC and normal samples via UALCAN database. (B) Expression analysis of COL1A1, COL1A2, COL3A1, and FN1 in GC and normal samples via OncoDB database. (C) Expression analysis of COL1A1, COL1A2, COL3A1, and FN1 in GC and normal samples via GEO GEPIA. (D) Expression analysis of COL1A1, COL1A2, COL3A1, and FN1 in GC samples belonging to different cancer stages. P-value < 0.05.