Submit an Article
Navigate
Home
Editorial Board
Editorial Policies
Current Volume
Archive
Scientific Integrity
Publication Ethics Statements
Interviews with Outstanding Authors
Newsroom
Sponsored Conferences
Podcast
Contact
Special Collections
Submit an Article
Online ISSN: 1945-4589
Research Paper
|
Volume 16, Issue 12
|
pp. 10489–10511
Identification of a signature of histone modifiers in kidney renal clear cell carcinoma
Back to article
Figure 2
(2 of 15)
−
100%
+
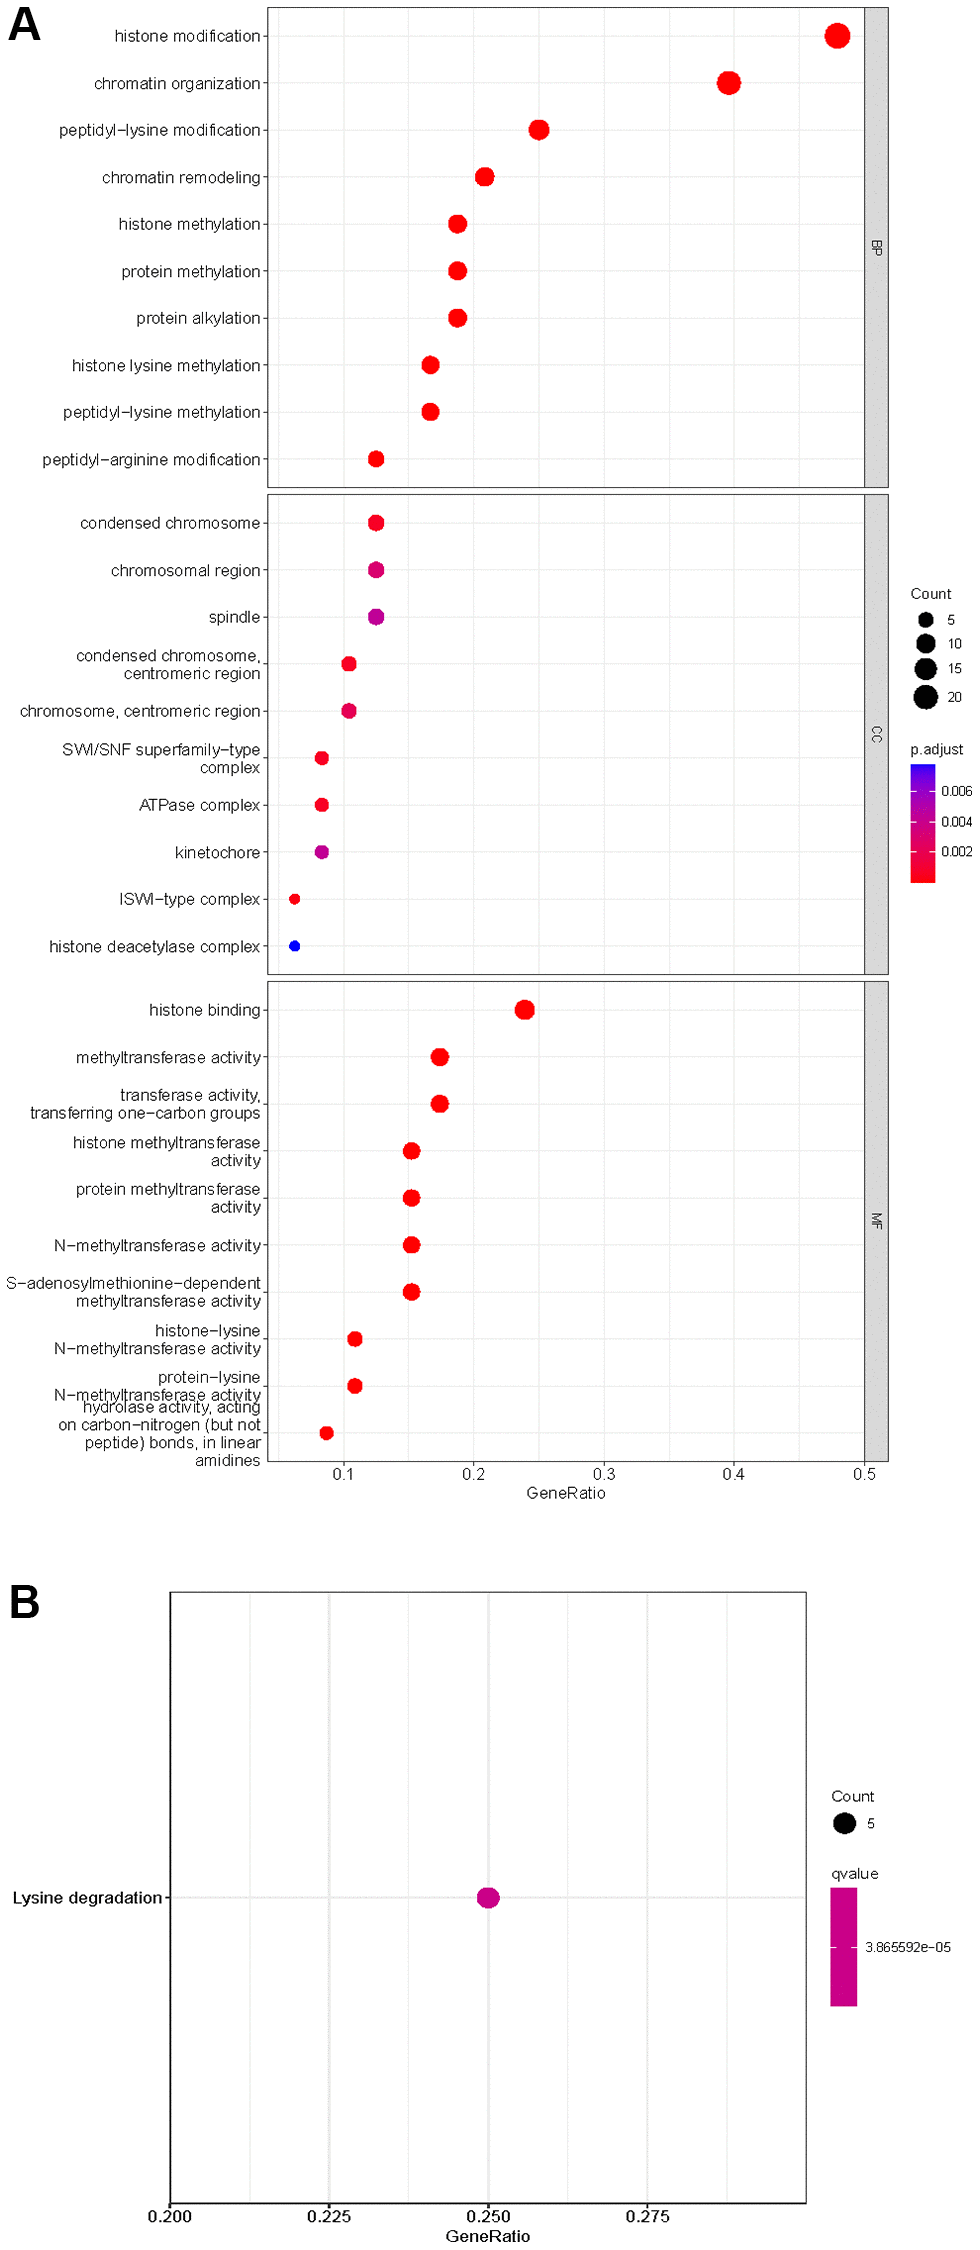
Figure 2.
Enrichment analysis of HMs differentially expressed in KIRC.
(
A
) GO analysis of HMs. (
B
) KEGG pathway enrichment analysis of HMs.