Submit an Article
Navigate
Home
Editorial Board
Editorial Policies
Current Volume
Archive
Scientific Integrity
Publication Ethics Statements
Interviews with Outstanding Authors
Newsroom
Sponsored Conferences
Podcast
Contact
Special Collections
Submit an Article
Online ISSN: 1945-4589
Research Paper
|
Volume 16, Issue 12
|
pp. 10477–10488
Causal role of immune cells in prostate cancer: a bidirectional Mendelian-randomization analyses
Back to article
Figure 2
(2 of 4)
−
100%
+
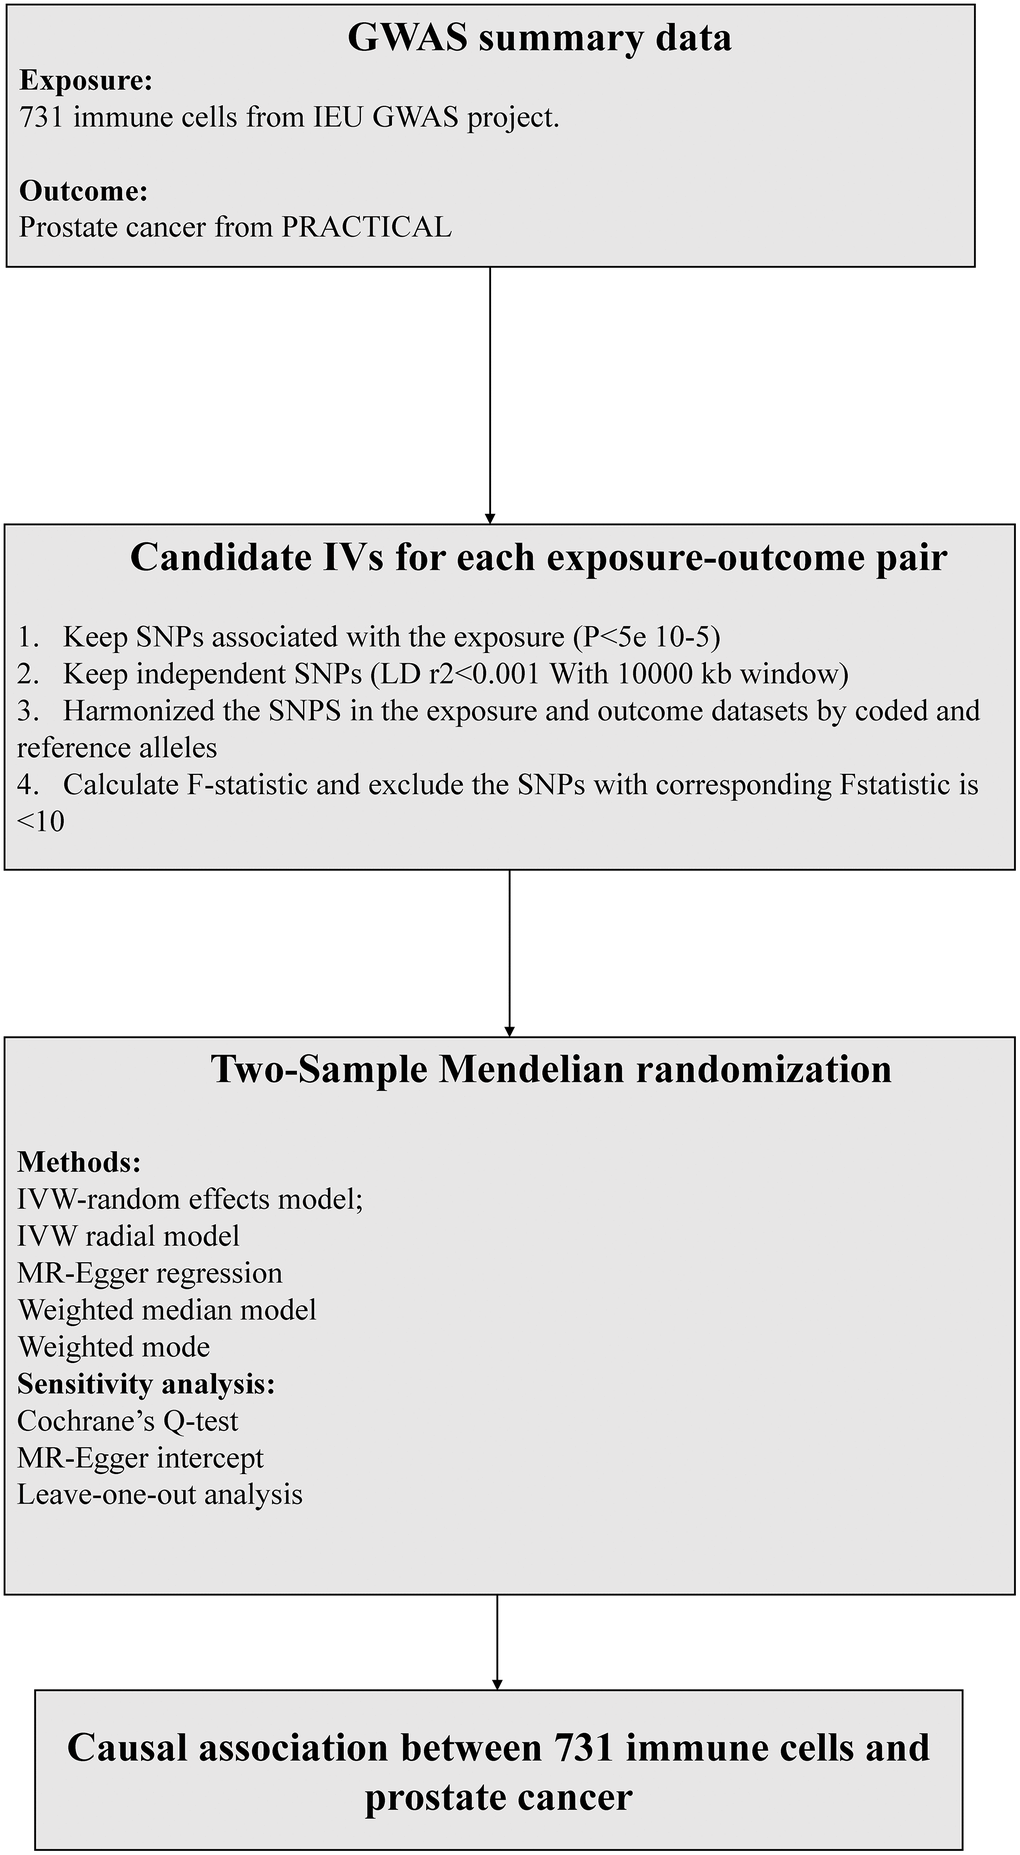
Figure 2.
The flow chart of the inclusion and exclusion criterion of candidate SNPs for each exposure-outcome pair.
MR, Mendelian randomization, IVW, inverse-variance weighted.