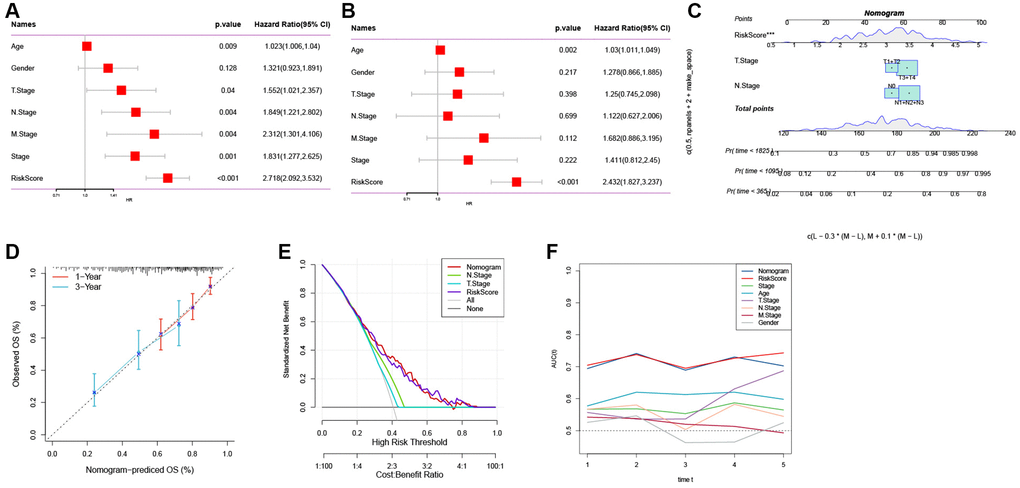
Figure 6.The development of a nomogram for predicting the prognosis of GC. (A, B) Univariate and multivariate Cox analysis of risk score and clinicopathological characteristics. (C) Nomogram model integrating the risk score and T stage, N stage was constructed. (D) Calibration curves for 1, 3 years of nomogram. (E) Decision curve for nomogram. (F) Comparison of predictive capacity of clinicopathological features and the nomogram using time-ROC analysis. ***P < 0.001.