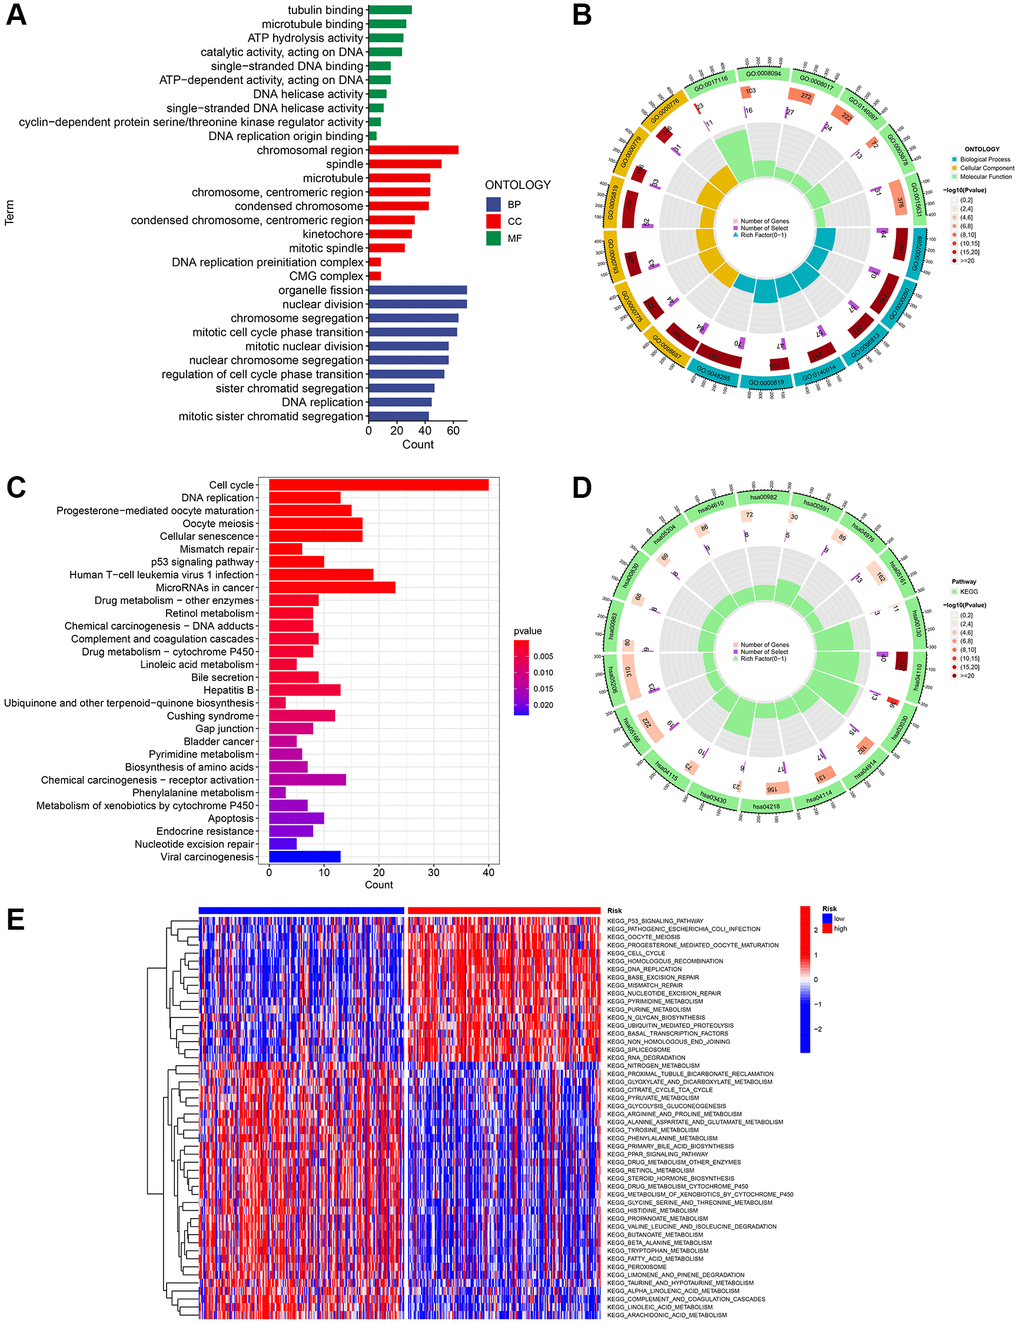
Figure 8.Investigation of the gene signature related to ubiquitination in the entire TCGA dataset using functional analyses. (A, B) Performing GO enrichment analysis on differentially expressed genes (DEGs) between the high-risk and low-risk groups. (C, D) Performing KEGG enrichment analysis on differentially expressed genes (DEGs) between the high-risk and low-risk groups. (E) Analysis of gene set variation (GSVA) in the high-risk and low-risk groups.