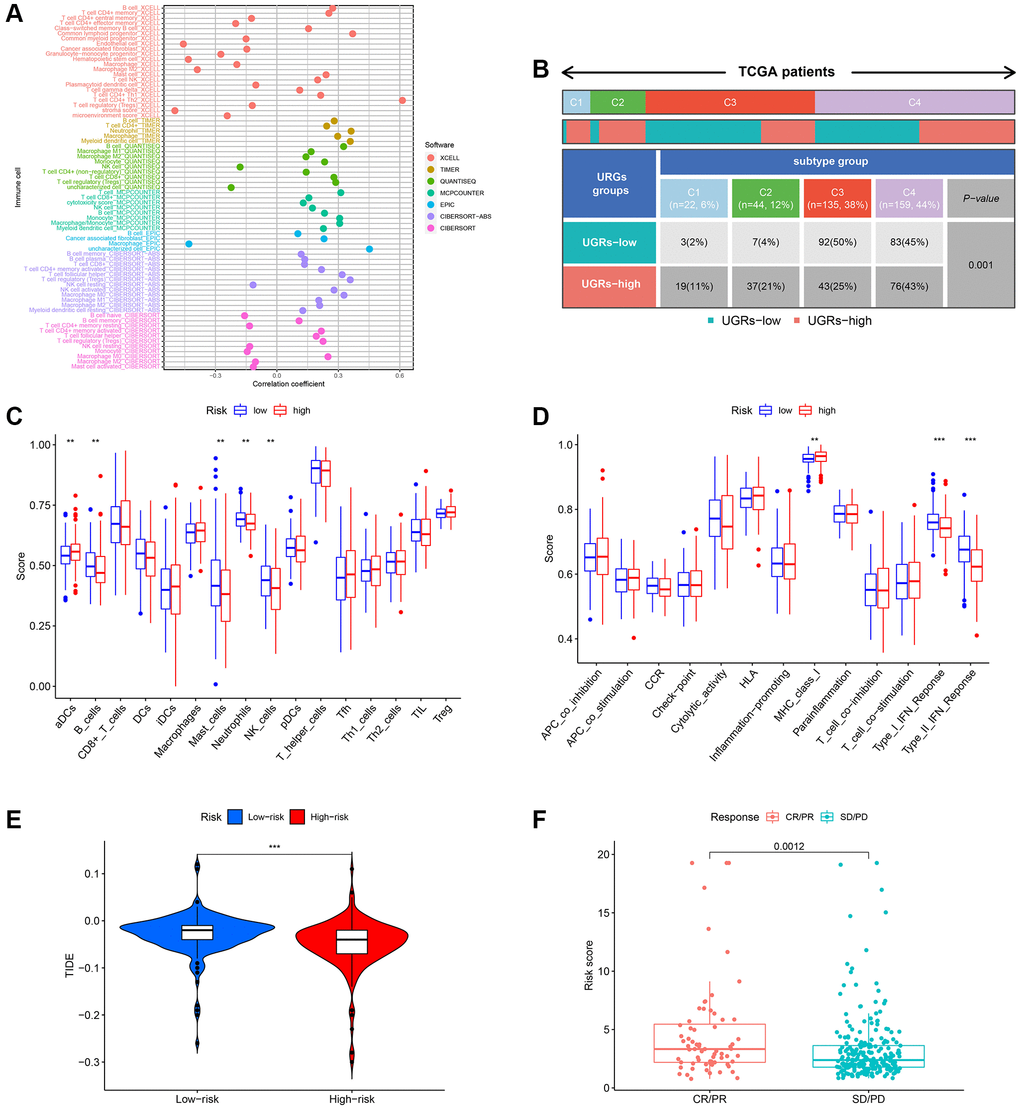
Figure 7.Evaluation of the infiltration of immune cells. (A) The XCELL, TIMER, QUANTISEQ, MCPCOUNTER, EPIC, CIBERSORT-ABS, and CIBERSORT algorithms were utilized to conduct correlation analysis between risk score and various immune cells. (B) The prevalence of TIME subtypes among TCGA patients. (C) Graphical representation of the infiltration of immune cells using a boxplot. (D) Boxplot illustrating the functionality of the immune system. (E) The TIDE score difference between the high-risk and low-risk groups. (F) Evaluating the risk score between the CR/PR and SD/PD groups. CR represents complete response, PR represents partial response, SD represents stable disease, and PD represents progressive disease.