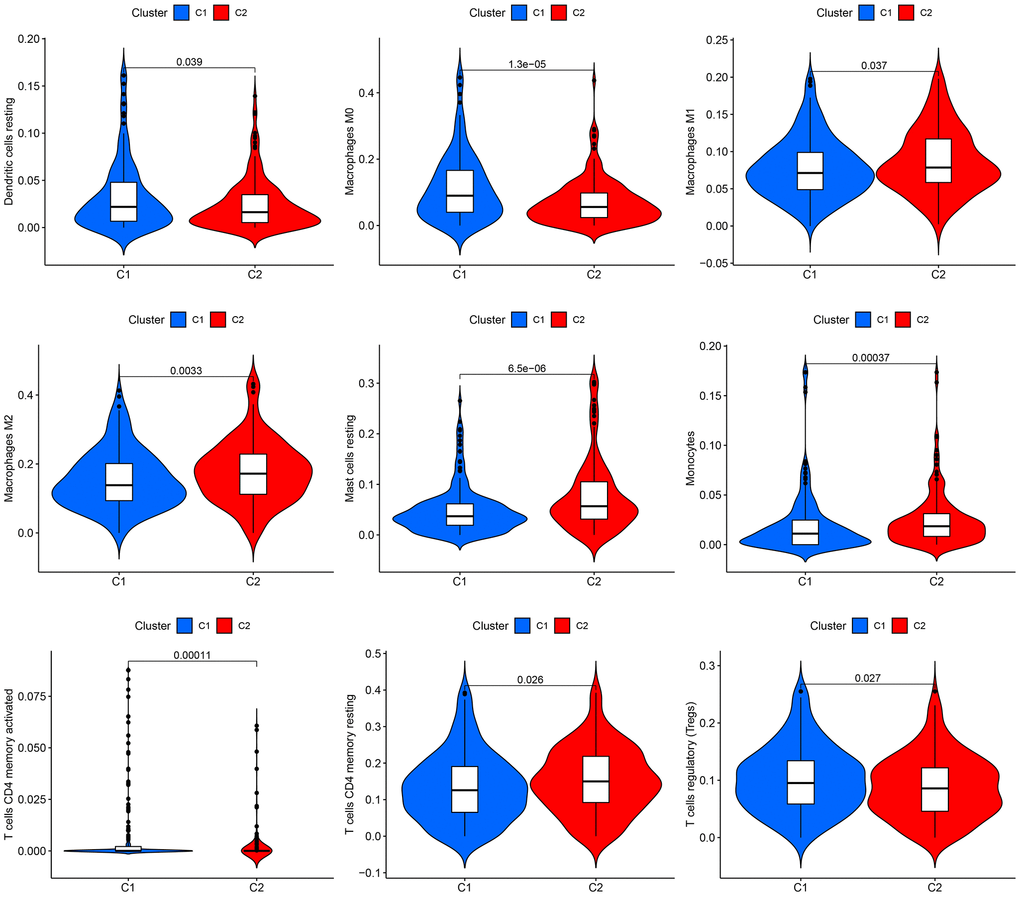
Figure 2.Infiltration of immune cells in the two groups. The two clusters display a violin plot illustrating dendritic cells, M0 macrophages, M1 macrophages, M2 macrophages, resting mast cells, monocytes, CD4 memory-activated T cells, CD4 memory resting T cells, and regulatory T cells (Tregs). Cluster 1 is referred to as C1, while Cluster 2 is known as C2.