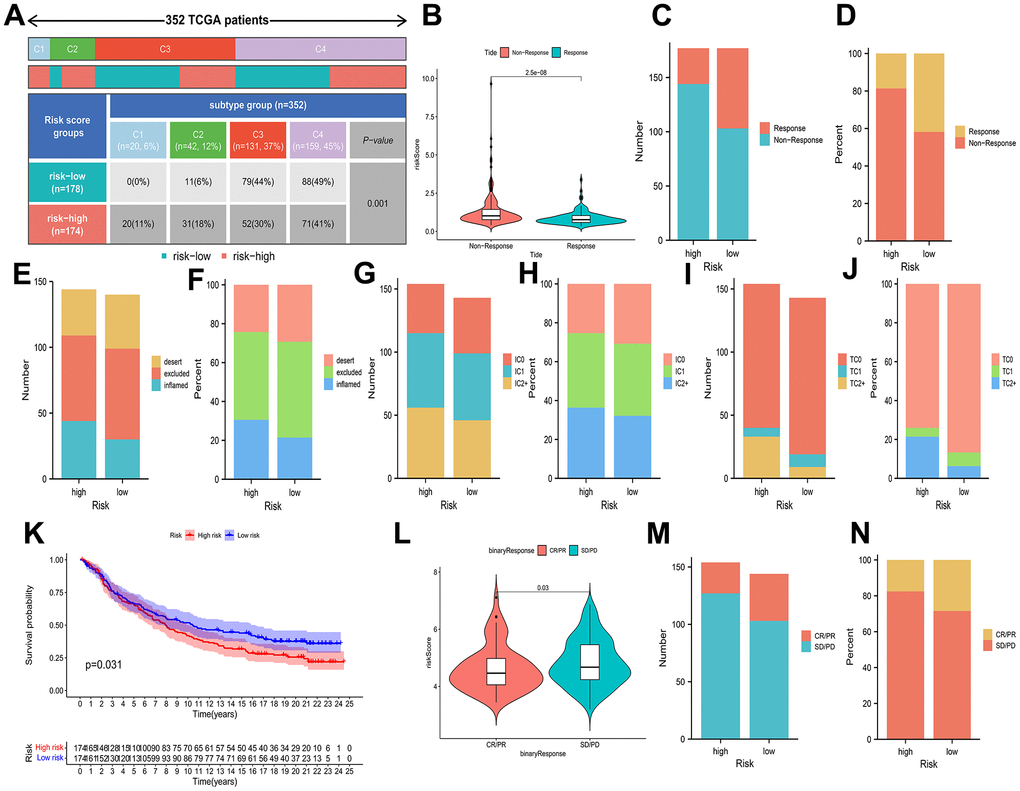
Figure 8.Associations of prognostic risk model and HCC immunotherapy. (A) A comparison of immune subtypes between different risk categories. (B) A comparison of risk scores between two response categories. (C–J) Stacked bar plot of rates of response, inflammatory immune subtypes, tumor-infiltrating immune cells, and PD-L1-expressing tumor tissue samples. (K) Kaplan-Meier curves of different risk categories. (L) A comparison of risk scores between the CR/PR category and stable disease (SD)/progressive disease (PD) category. (M, N) Stacked bar plot of CR/PR and SD/PD.