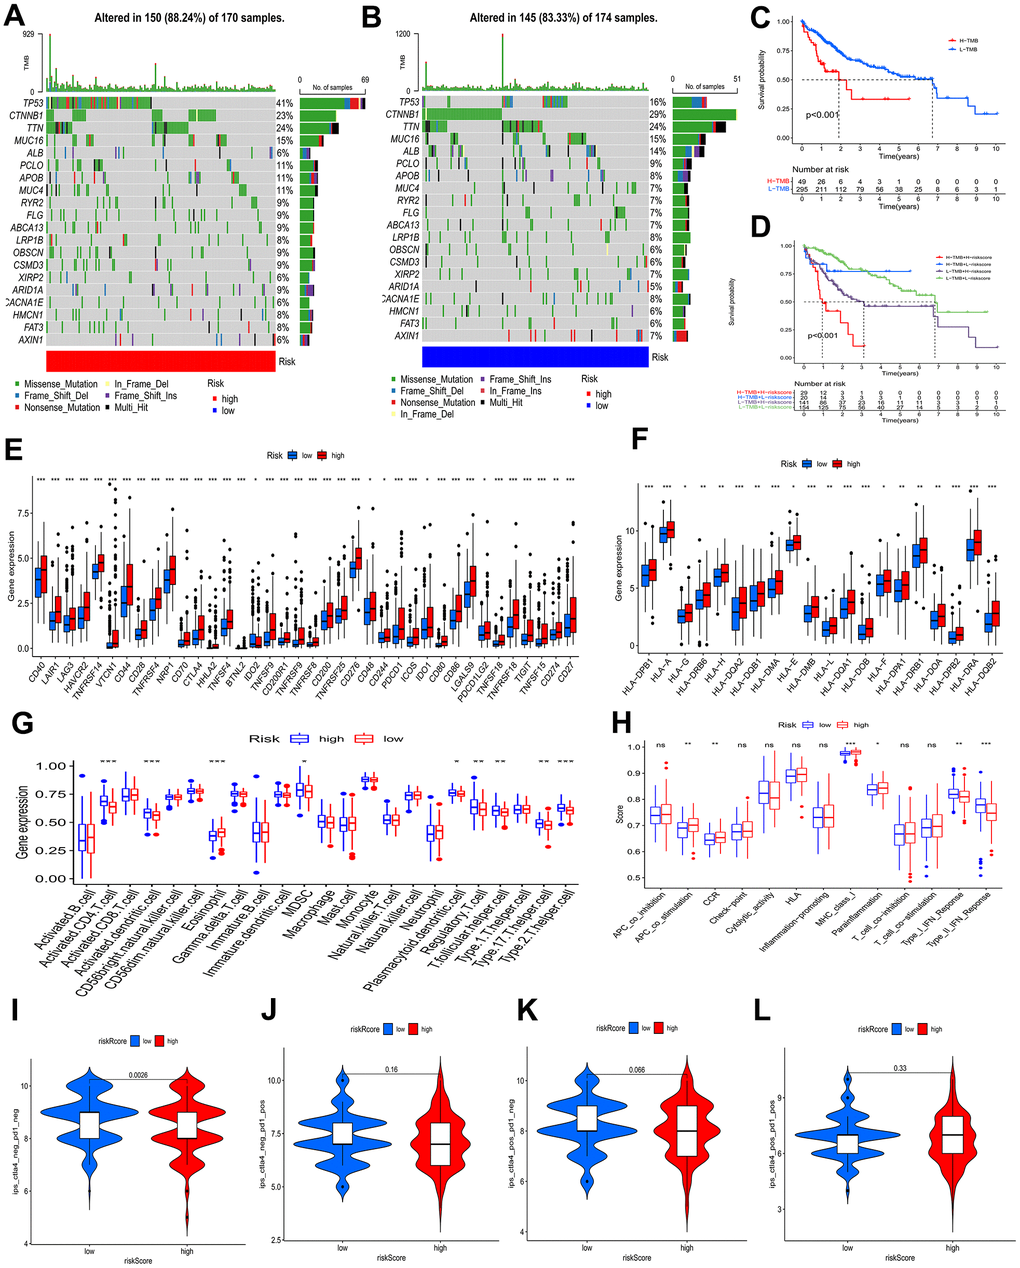
Figure 7.Analysis of tumor mutation and immune cell infiltration. (A, B) The waterfall plot showing the differences in somatic genomic mutation between high and low risk categories. (C, D) The Kaplan−Meier curve based on both TMB categories and the model for HCC patients. (E, F) Different risk categories expressed different levels of checkpoint genes and HLA genes. (G, H) Immune cell and immune function scores of different risk categories. Comparison of IPS between two risk categories. (I) CTLA4− PD1−, (J) CTLA4− PD1+, (K) CTLA4+ PD1−, and (L) CTLA4+ PD1+. ns p > 0.05; * p < 0.05; ** p < 0.01; *** p < 0.001.