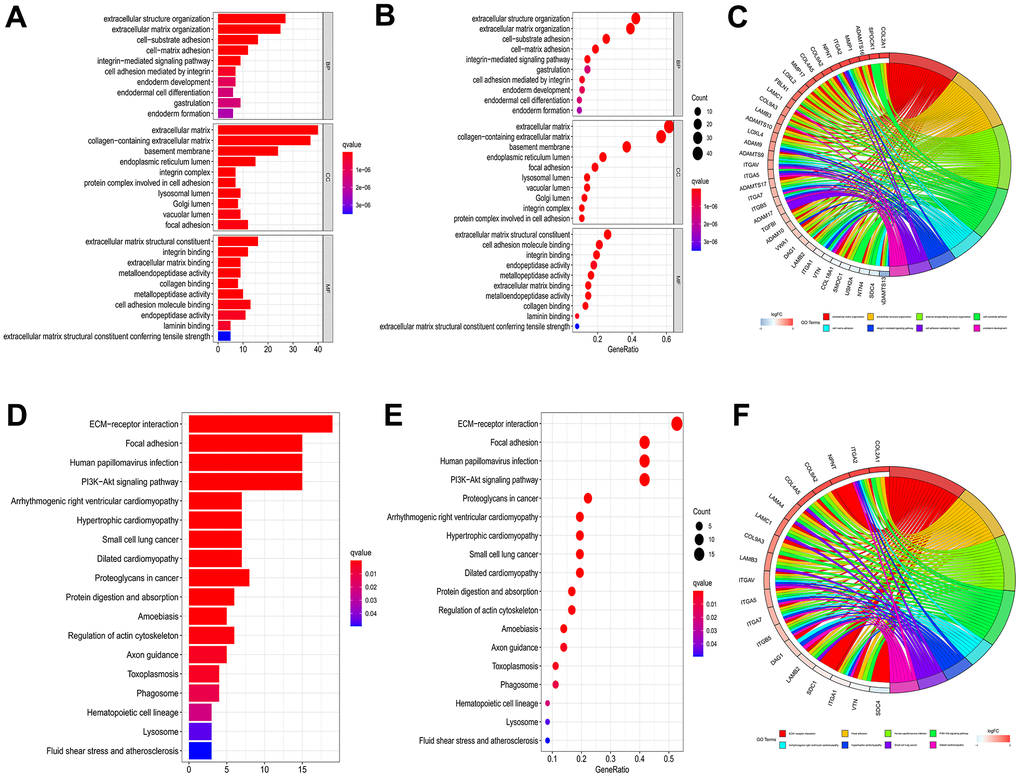
Figure 2.GO and KEGG enrichment analysis to 66 genes of intersection. Barplot (A), bubble plot (B) and chord diagram (C) of GO analyses of genes of intersection. Barplot (D), bubble plot (E) and chord diagram (F) of KEGG analyses of genes of intersection.