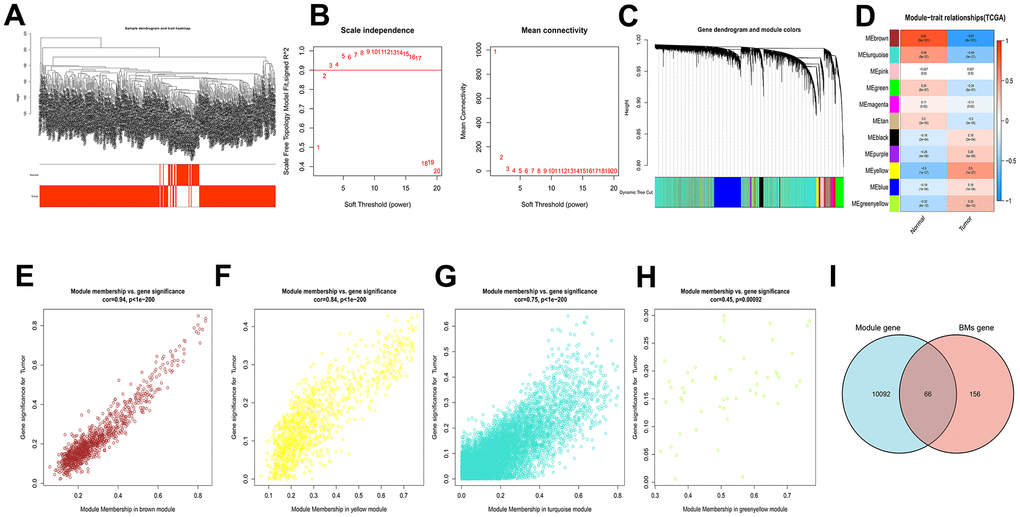
Figure 1.WGCNA analysis results of 10158 genes of HCC. (A) Clustering dendrogram of HCC samples. (B) The scale–free fit index for soft–thresholding powers. (C) A dendrogram of the differentially expressed genes clustering based on different metrics. (D) A heatmap showing the correlation between the gene module and associated traits. (E–H) Scatter plots of module eigengenes in brown, yellow, turquoise and greenyellow modules. (I) Venn diagram showed the intersection of genes of HCC and BMGs.