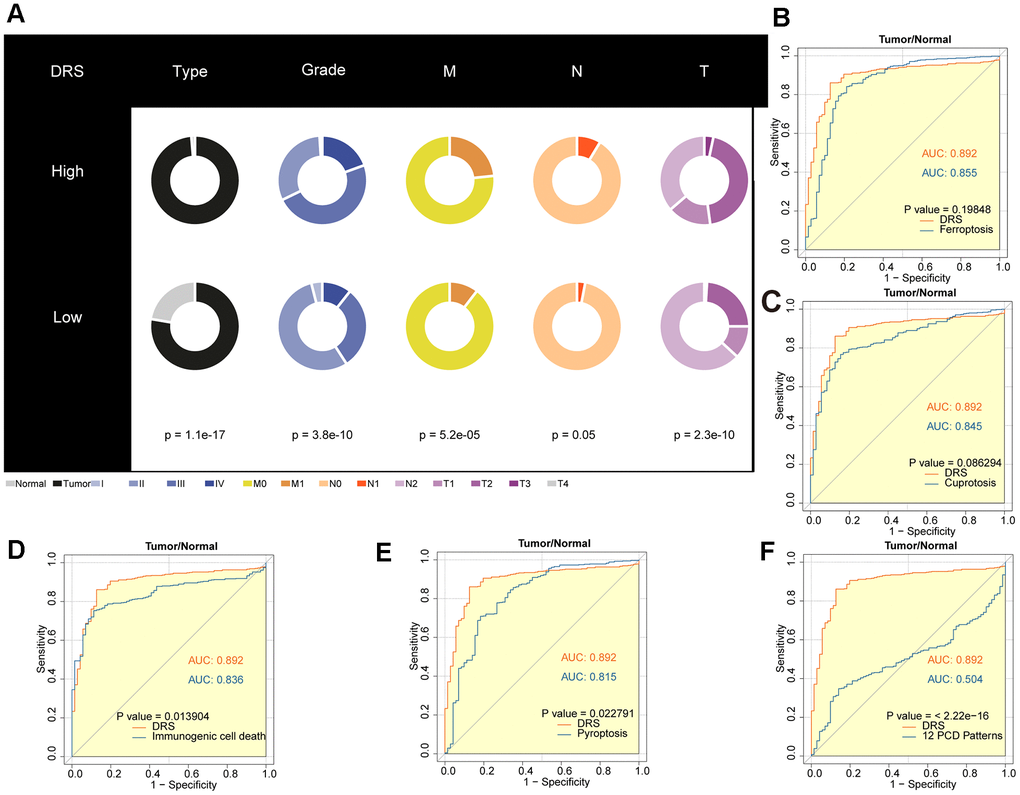
Figure 9.Diagnostic value analysis of the DRS in ccRCC. (A) Pie charts showing the chi-square test of clinicopathological factors for DRS in ccRCC. (B–F) AUC analysis of the DRS and other PCD-related models for distinguishing ccRCC from normal RCC. p < 0.05 was considered statistically significant.