Submit an Article
Navigate
Home
Editorial Board
Editorial Policies
Current Volume
Archive
Scientific Integrity
Publication Ethics Statements
Interviews with Outstanding Authors
Newsroom
Sponsored Conferences
Podcast
Contact
Special Collections
Submit an Article
Online ISSN: 1945-4589
Research Paper
|
Volume 16, Issue 11
|
pp. 10033–10062
A new perspective: deciphering the aberrance and clinical implication of disulfidptosis signatures in clear cell renal cell carcinoma
Back to article
Figure 7
(7 of 13)
−
100%
+
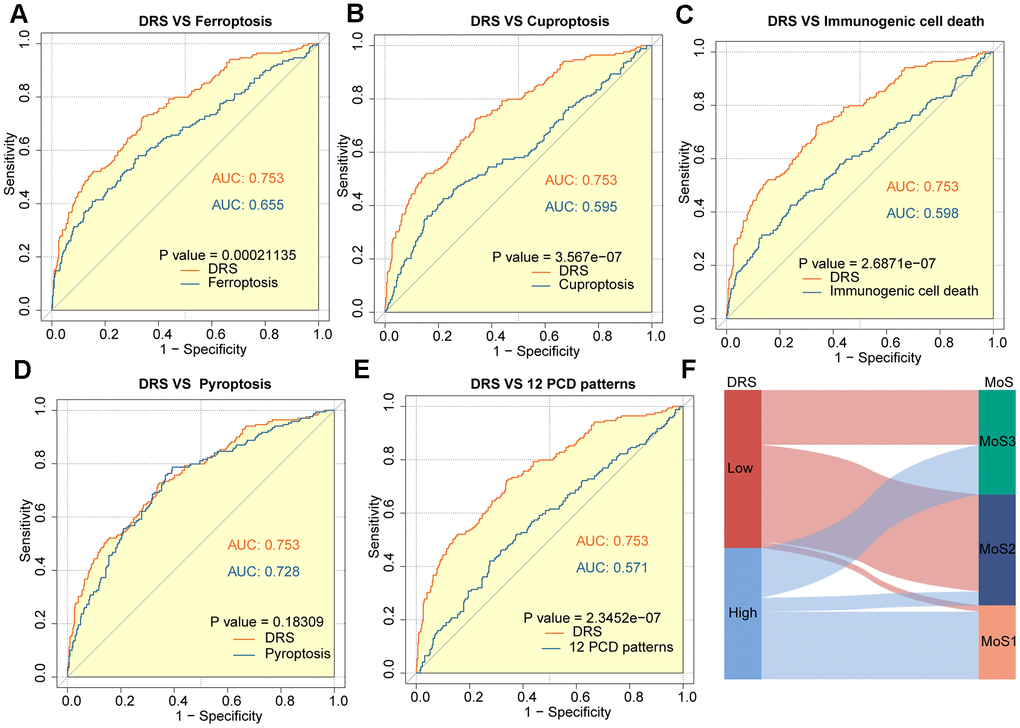
Figure 7.
Outstanding performance of DRS compared to other cell death-related models.
(
A
–
E
) AUC analysis of the DRS and other PCD-related models in the TCGA-KIRC cohort. (
F
) The alluvial plot shows the association between DRS and MoS subtypes.