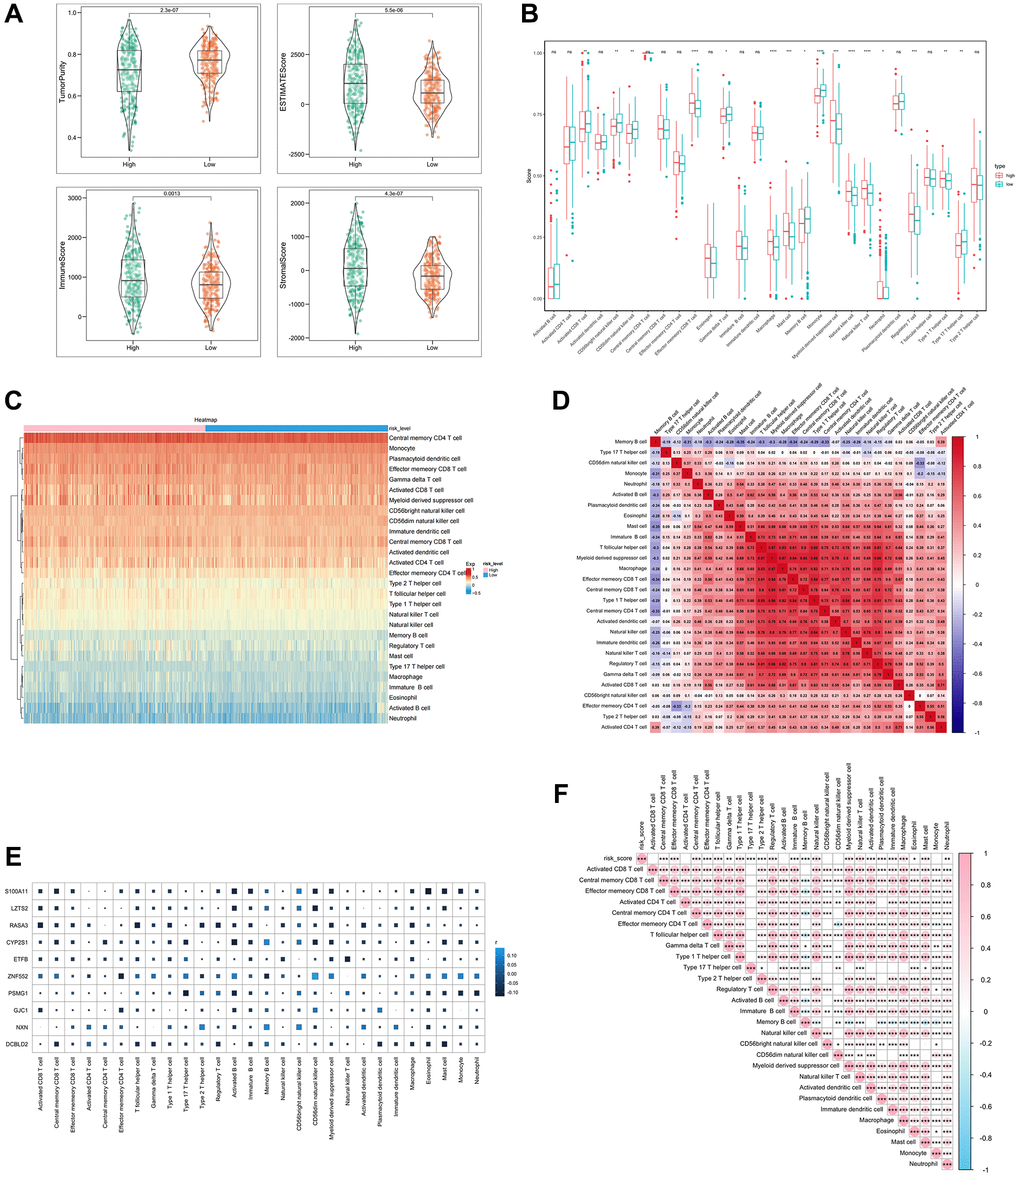
Figure 4.Analysis of immune cell infiltration with SERGs risk group. (A) The ESTIMATE score, Immune score, and Stromal score between high- and low- SERGs risk groups were compared. (B) Violin diagram of 28 type immune cells in two groups. (C) Immune cells assessment between two groups. (D) Analysis of correlation in 28 type immune cells. (E) Correlation analysis of ten prognostic biomarkers (S100A11, LZTS2, CYP2S1, ZNF552, PSMG1, GJC1, NXN and DCBLD2) and immune cells. (F) Correlation analysis of risk score and immune cells.