Submit an Article
Navigate
Home
Editorial Board
Editorial Policies
Current Volume
Archive
Scientific Integrity
Publication Ethics Statements
Interviews with Outstanding Authors
Newsroom
Sponsored Conferences
Podcast
Contact
Special Collections
Submit an Article
Online ISSN: 1945-4589
Research Paper
|
Volume 16, Issue 11
|
pp. 9899–9917
Construction and validation of a prognostic signature based on anoikis-related lncRNAs in lung adenocarcinoma
Back to article
Figure 2
(2 of 12)
−
100%
+
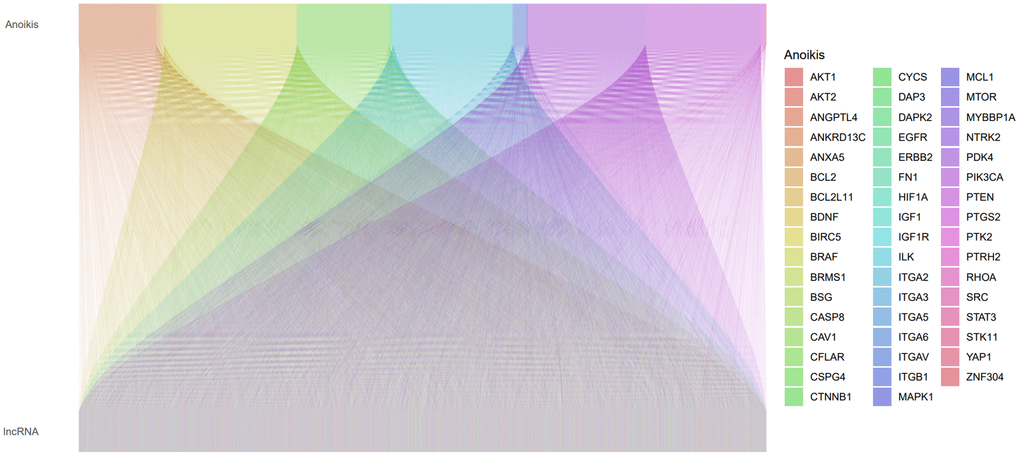
Figure 2.
A Sankey plot illustrating the relationship between lncRNAs and anoikis-related genes (ARGs).