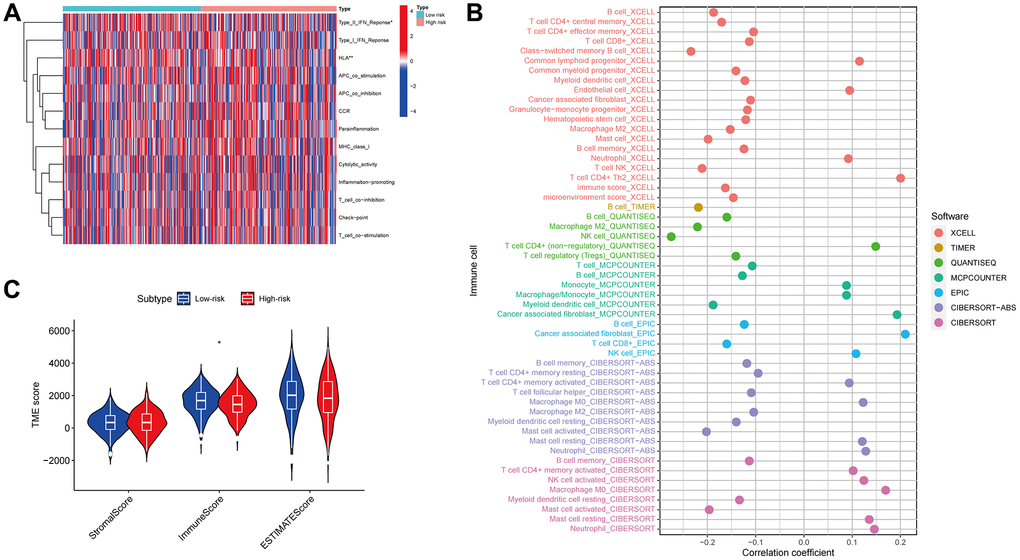
Figure 10.Immune function. Immunological functions of the high- and low-risk groups are depicted on the heatmap (A). The association of immune cells with the risk score (B). The correlation between the risk and TME scores (C).
Figure 10 — Construction and validation of a prognostic signature based on anoikis-related lncRNAs in lung adenocarcinoma | Aging