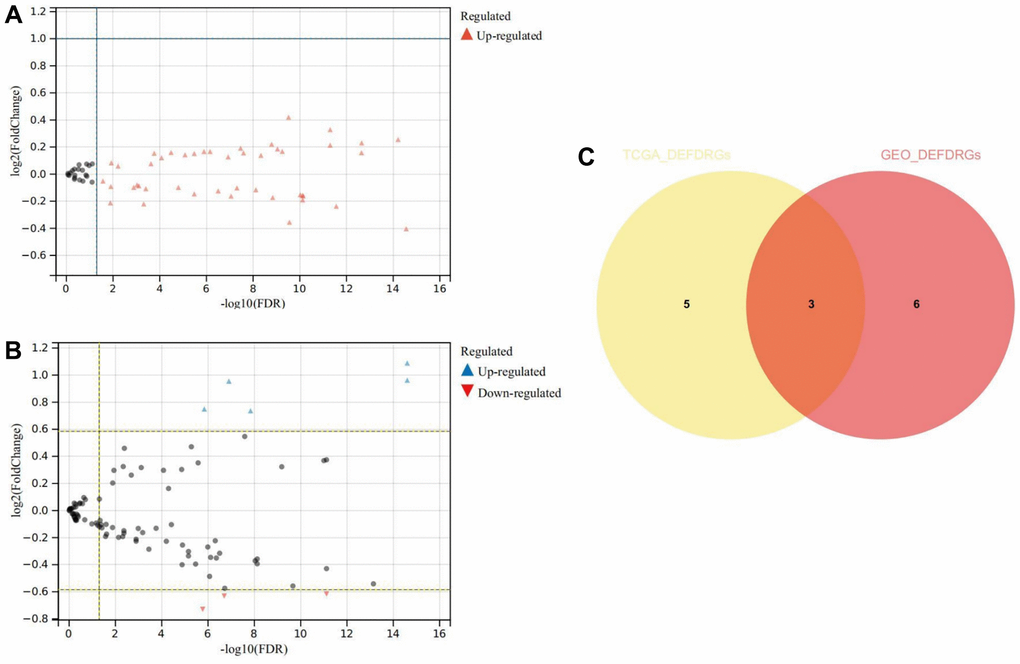
Figure 5.Differential expression and correlation analysis. (A) Volcanic map of DEDRGs in TCGA-THCA. (B) Volcanic map of DEDRGs in GSE33630. (C) Venn diagram of co-DEDRGs. * represents P < 0.05, *** represents P < 0.001, **** represents P < 0.0001, - represents no significant difference.