Submit an Article
Navigate
Home
Editorial Board
Editorial Policies
Current Volume
Archive
Scientific Integrity
Publication Ethics Statements
Interviews with Outstanding Authors
Newsroom
Sponsored Conferences
Podcast
Contact
Special Collections
Submit an Article
Online ISSN: 1945-4589
Research Paper
|
Volume 16, Issue 11
|
pp. 9753–9783
Identification of disulfidptosis-associated genes and characterization of immune cell infiltration in thyroid carcinoma
Back to article
Figure 3
(3 of 15)
−
100%
+
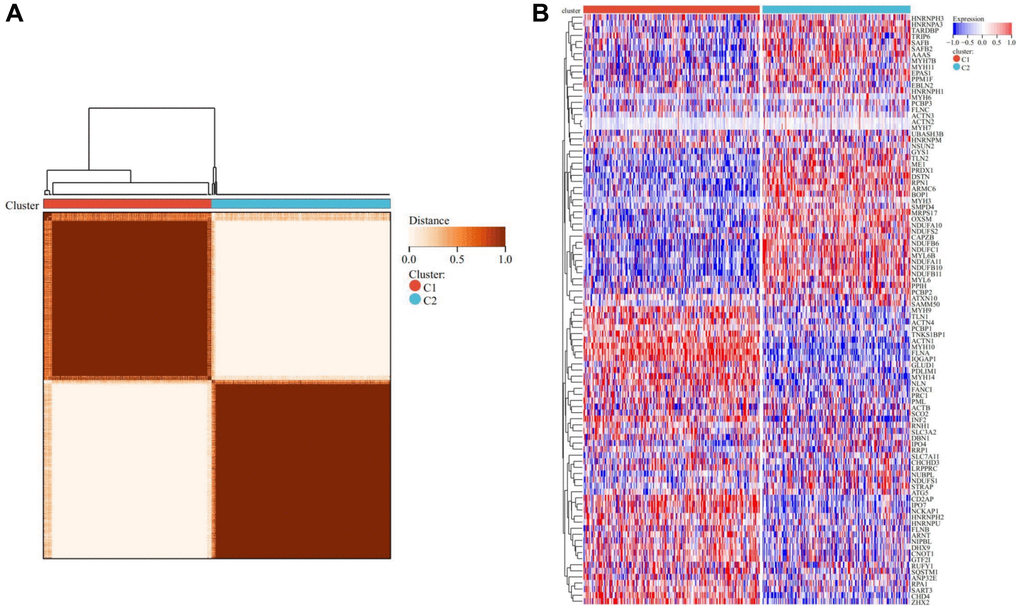
Figure 3.
Consensus clustering analysis.
(
A
) Represents that when k = 2, the matrix heatmap was neatly classified. (
B
) Heatmap of DRGs-related expression profile in cluster C1 and C2 subtypes.