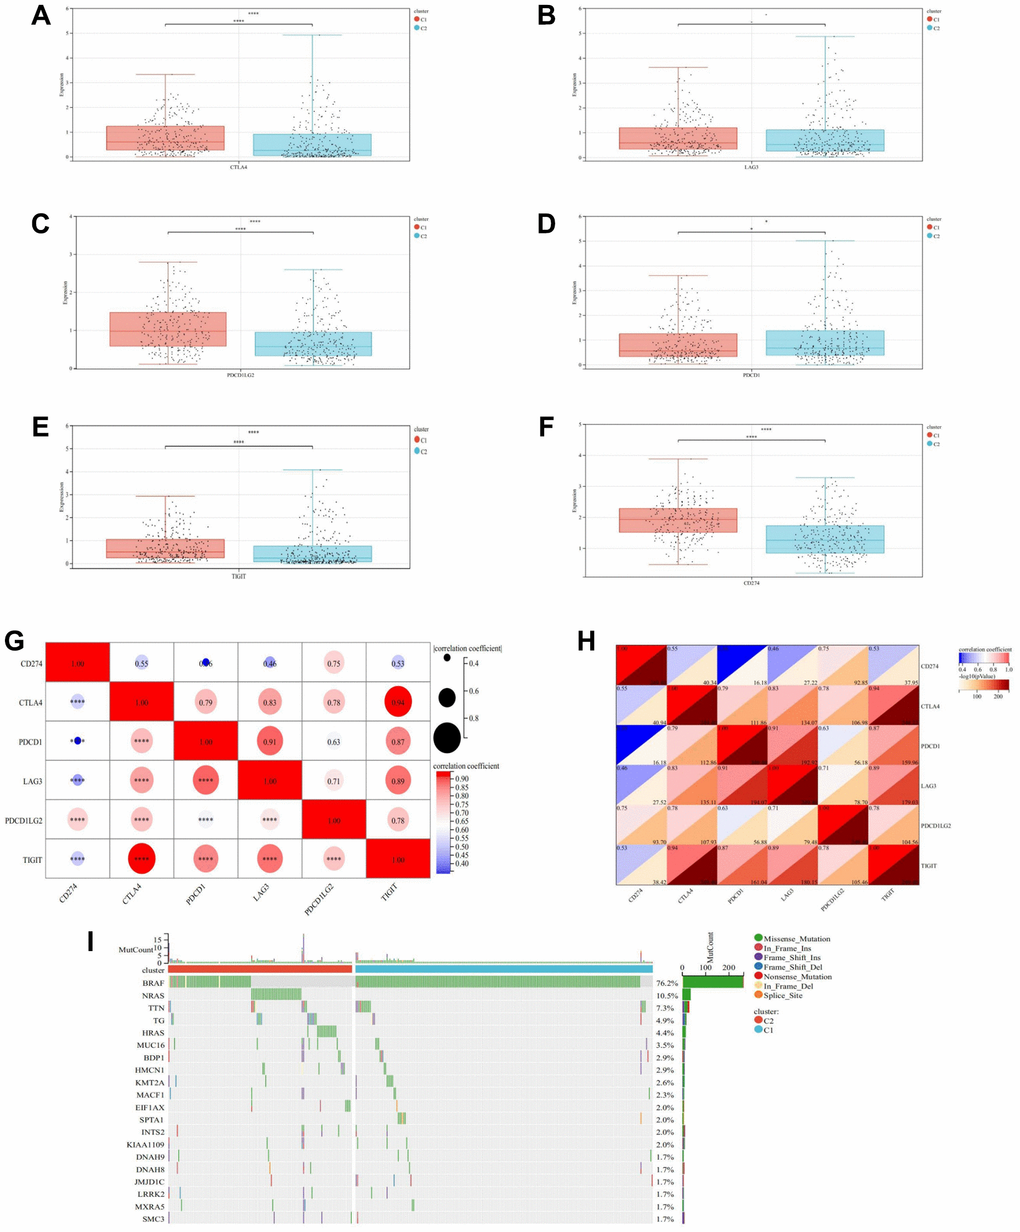
Figure 11.Immune checkpoints analysis and mutation landscape. (A) Expression difference of CTLA4 in two subtypes. (B) Expression difference of LAG3 in two subtypes. (C) Expression difference of PD-L1 in two subtypes. (D) Expression difference of PD-1 in two subtypes. (E) Expression difference of TIGIT in two subtypes. (F) Expression difference of CD274 in two subtypes. (G, H) Heatmap of correlation analysis between immune checkpoints. (I) Waterfall map of the Mutation landscape. * represents P < 0.05, ** represents P < 0.01, *** represents P < 0.001, **** represents P < 0.0001, - represents no significant difference.