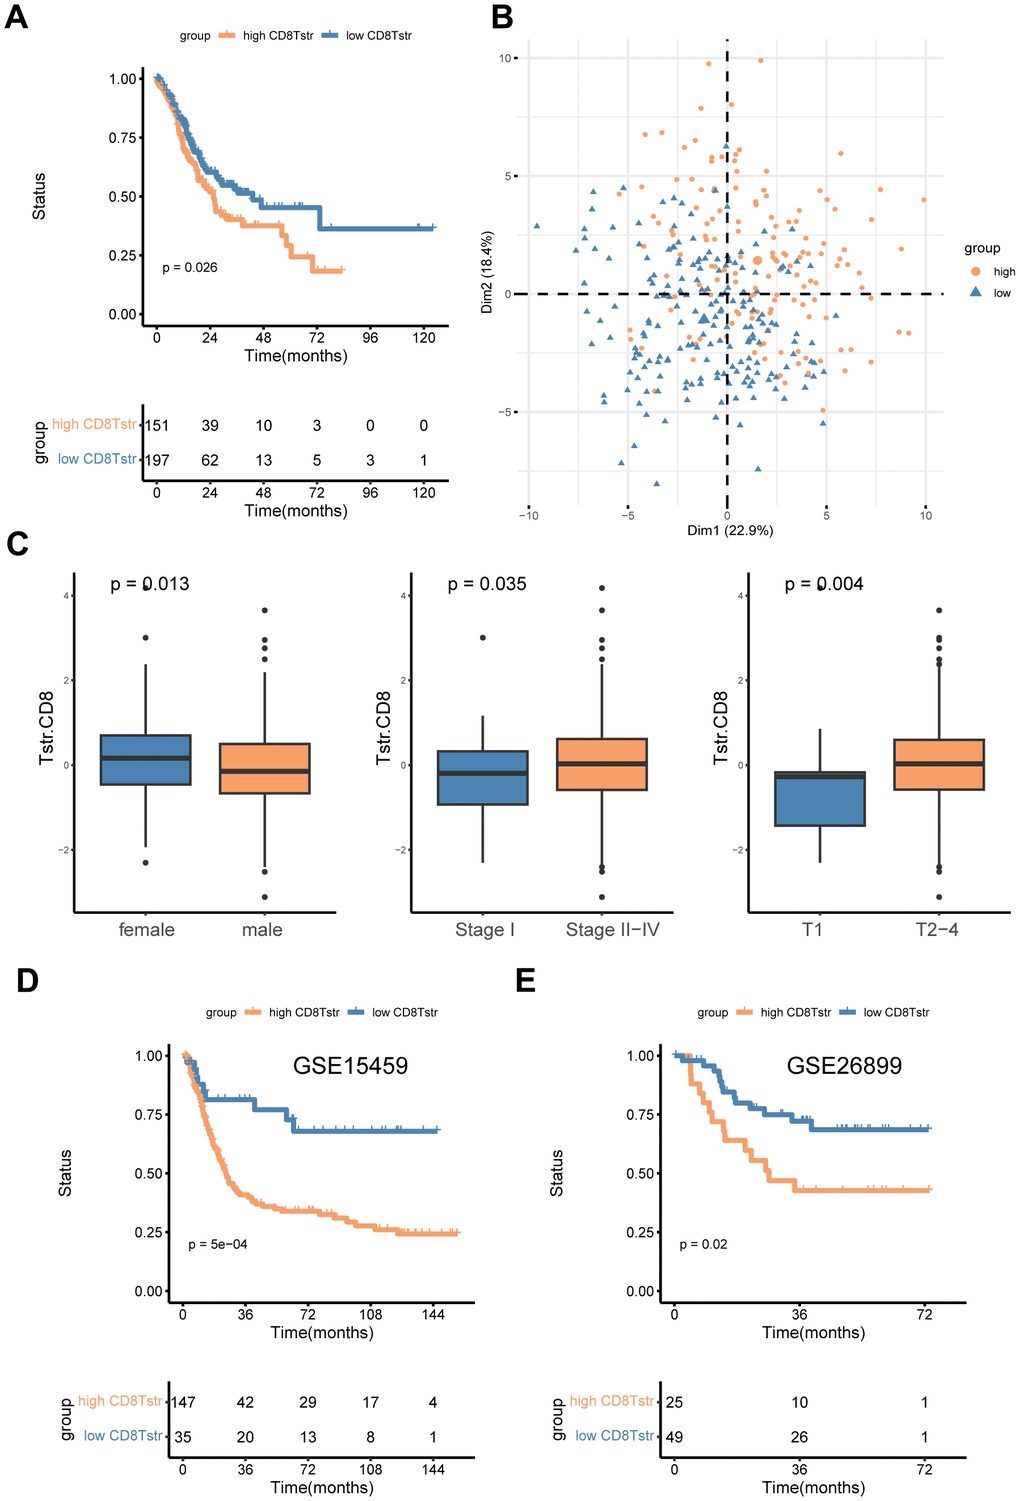
Figure 3.High/low CD8+ TSTR groups classification. (A) Kaplan-Meier survival curves for OS in the training cohort TCGA-GC. (B) PCA for the high/low CD8+ TSTR groups. (C) Infiltration of CD8+ TSTR cells according to gender (female/male), stage (I/II -IV) and T stage (1/2-4). (D) Kaplan-Meier survival curves for OS in the GC dataset GSE15459. (E) Kaplan-Meier survival curves for OS in the GC dataset GSE26899.