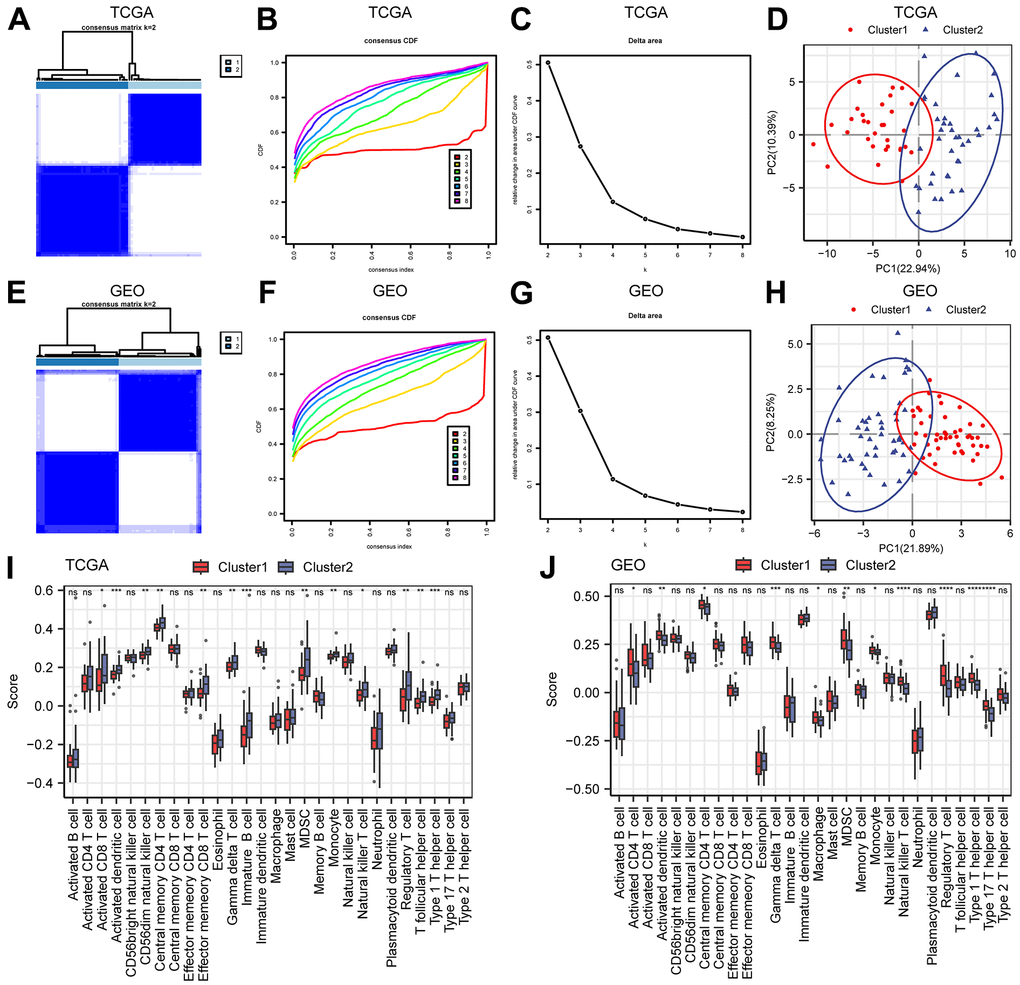
Figure 2.Construction of molecular subtypes. (A–C) The consistency clustering heatmap (A), consistency clustering cumulative distribution map (B), and consistency clustering Delta (C) of ESCC samples in the TCGA-ESCC dataset. (D) PCA diagram of TCGA-ESCC molecular subtypes. (E–G) Consistency clustering heatmap (E), consistency clustering cumulative distribution map (F), and consistency clustering Delta (G) of the merged GEO dataset. (H) PCA diagram of molecular subtypes in the merged GEO dataset. (I, J) Comparison of immune infiltration groups for different clusters in the TCGA-ESCC dataset (I) and the merged GEO dataset (J). Ns stands for P≥0.05, * for P<0.05, ** for P<0.01, *** for P<0.001, and **** for P<0.0001.