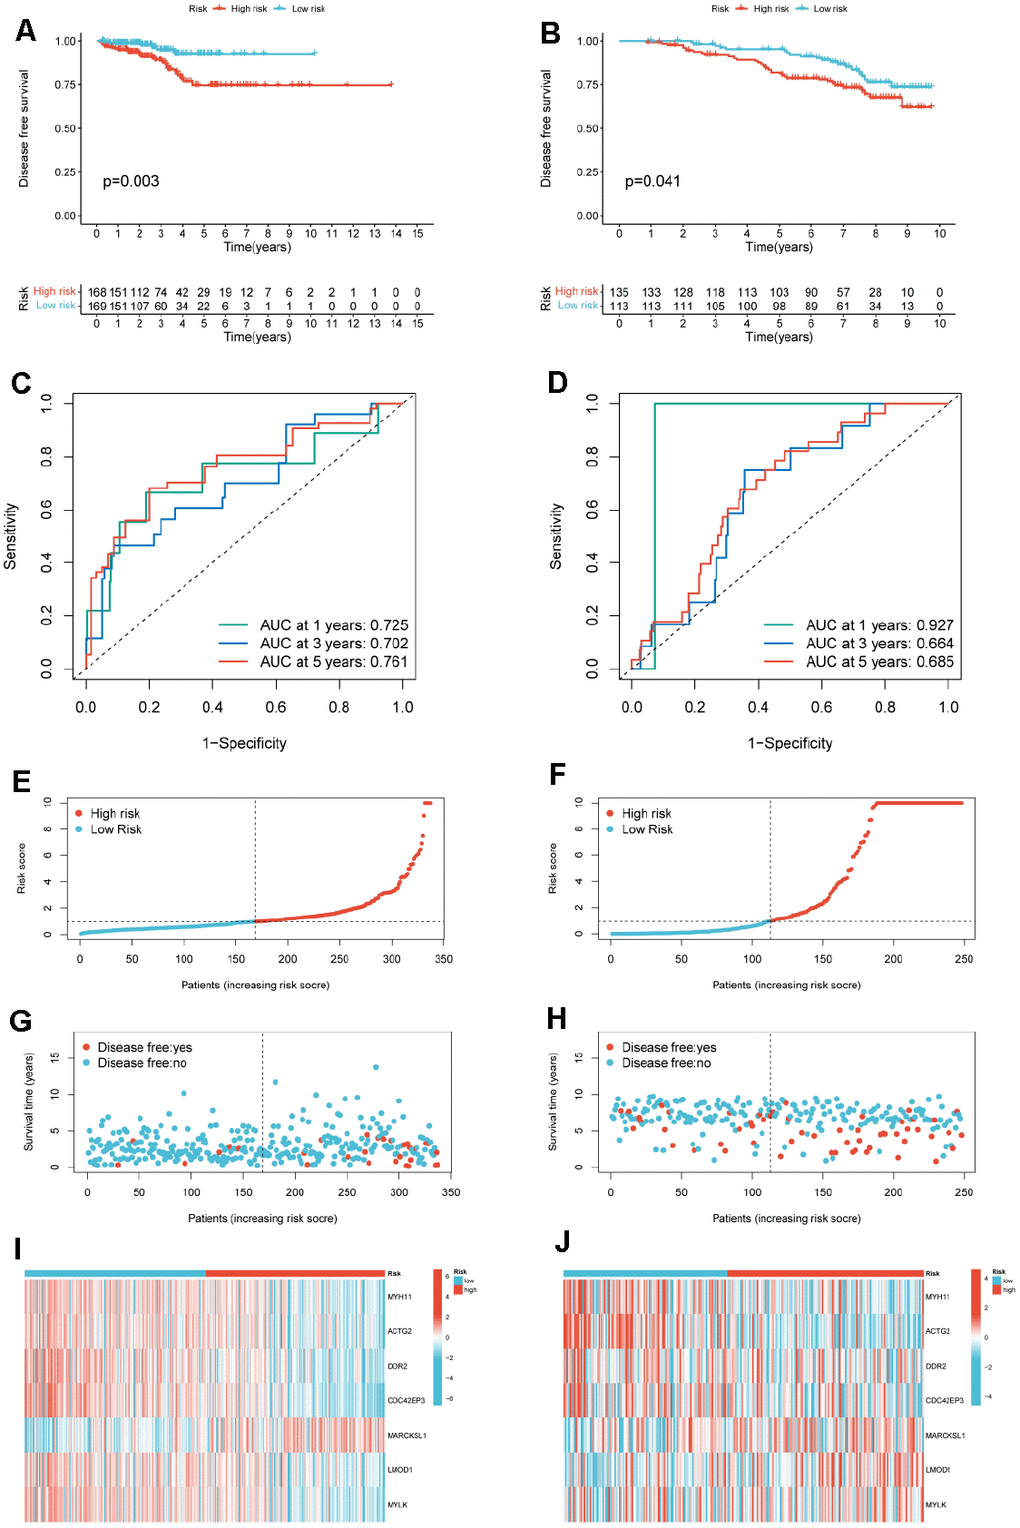
Figure 7.Construction of a risk model for PCa patients. (A) KM curves for PCa cancer patients in the high-/low-risk group in TCGA-PRAD. (B) KM curves for PCa cancer patients in the high-/low-risk group in GSE116918. (C) ROC curves of the risk model of 1-, 3-, and 5-years for DFS for the TCGA-PRAD. (D) ROC curves of the risk model of 1-, 3-, and 5-years for DFS for the GSE116918. Distribution of the risk score for TCGA-PRAD (E) and GSE116918 (F). Scatter plot of disease free status and risk score for TCGA-PRAD (G) and GSE116918 (H). Heatmap of the expression profile of the 7-mRNAs in TCGA-PRAD (I) and GSE116918 (J).