Submit an Article
Navigate
Home
Editorial Board
Editorial Policies
Current Volume
Archive
Scientific Integrity
Publication Ethics Statements
Interviews with Outstanding Authors
Newsroom
Sponsored Conferences
Podcast
Contact
Special Collections
Submit an Article
Online ISSN: 1945-4589
Research Paper
|
Volume 16, Issue 11
|
pp. 9599–9624
Prognosis and diagnosis of prostate cancer based on hypergraph regularization sparse least partial squares regression algorithm
Back to article
Figure 3
(3 of 11)
−
100%
+
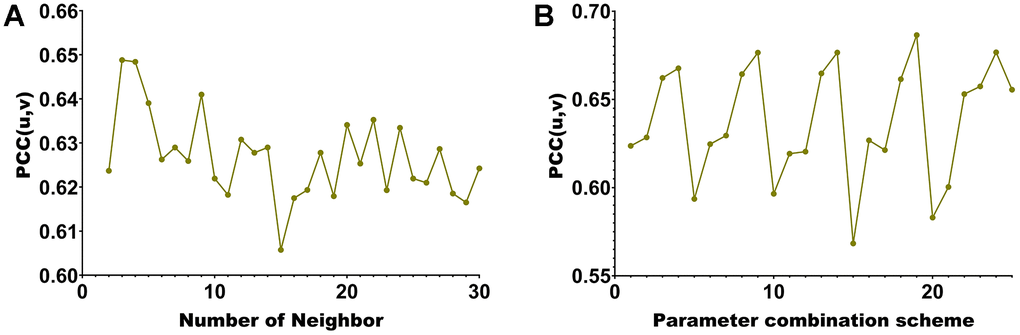
Figure 3.
Hyperparameter selection line chart.
(
A
) corresponding to different number of neighbors of KNN. (
B
) corresponding to different parameter combinations.