Submit an Article
Navigate
Home
Editorial Board
Editorial Policies
Current Volume
Archive
Scientific Integrity
Publication Ethics Statements
Interviews with Outstanding Authors
Newsroom
Sponsored Conferences
Podcast
Contact
Special Collections
Submit an Article
Online ISSN: 1945-4589
Research Paper
|
Volume 16, Issue 11
|
pp. 9569–9583
Attenuating bone loss in osteoporosis: the potential of corylin (CL) as a therapeutic agent
Back to article
Figure 8
(8 of 8)
−
100%
+
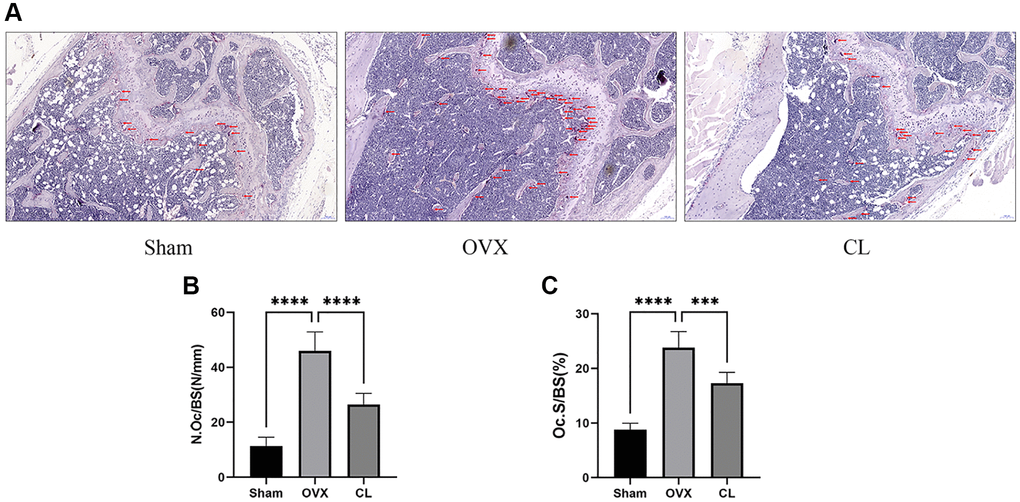
Figure 8.
Inhibition of osteoclast formation
in vivo
by CL administration.
(
A
) The TRAP staining image from bone samples. (
B
,
C
) The histomorphometric quantifying (N.Oc/BS and OcS/BS) of TRAP-positive osteoclasts.
***
P
< 0.001;
****
P
< 0.0001.