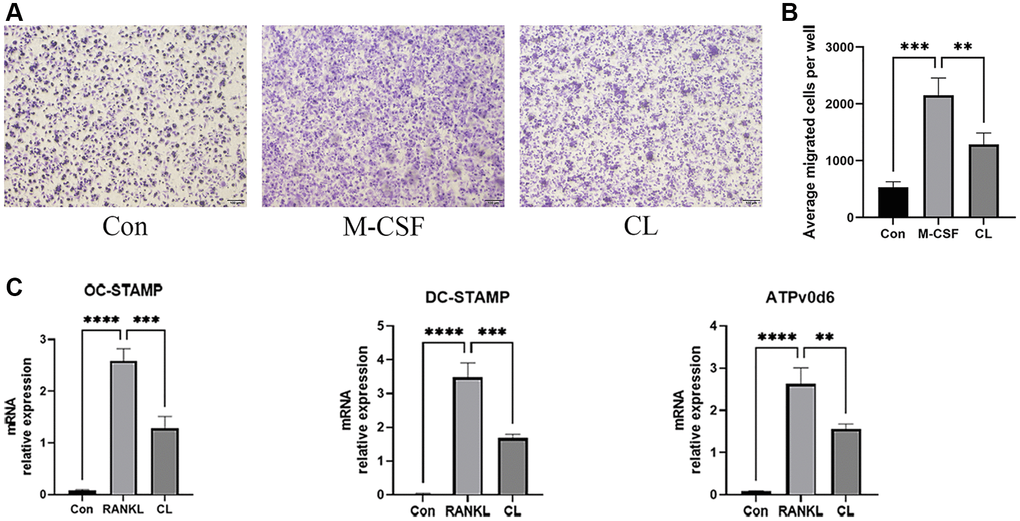
Figure 4.Inhibition of pre-osteoclast migration and fusion by CL. (A) The crystal violet staining image from pre-osteoclast treated with CL. (B) The number quantifying of migrated cells. (C) The analysis of the relative mRNA levels of OC-STAMP, DC-STAMP, and ATPv0d6. **P < 0.01; ***P < 0.001; ****P < 0.0001.