Submit an Article
Navigate
Home
Editorial Board
Editorial Policies
Current Volume
Archive
Scientific Integrity
Publication Ethics Statements
Interviews with Outstanding Authors
Newsroom
Sponsored Conferences
Podcast
Contact
Special Collections
Submit an Article
Online ISSN: 1945-4589
Research Paper
|
Volume 16, Issue 11
|
pp. 9437–9459
Machine learning-based identification and immune characterization of ferroptosis-related molecular clusters in osteoarthritis and validation
Back to article
Figure 5
(5 of 8)
−
100%
+
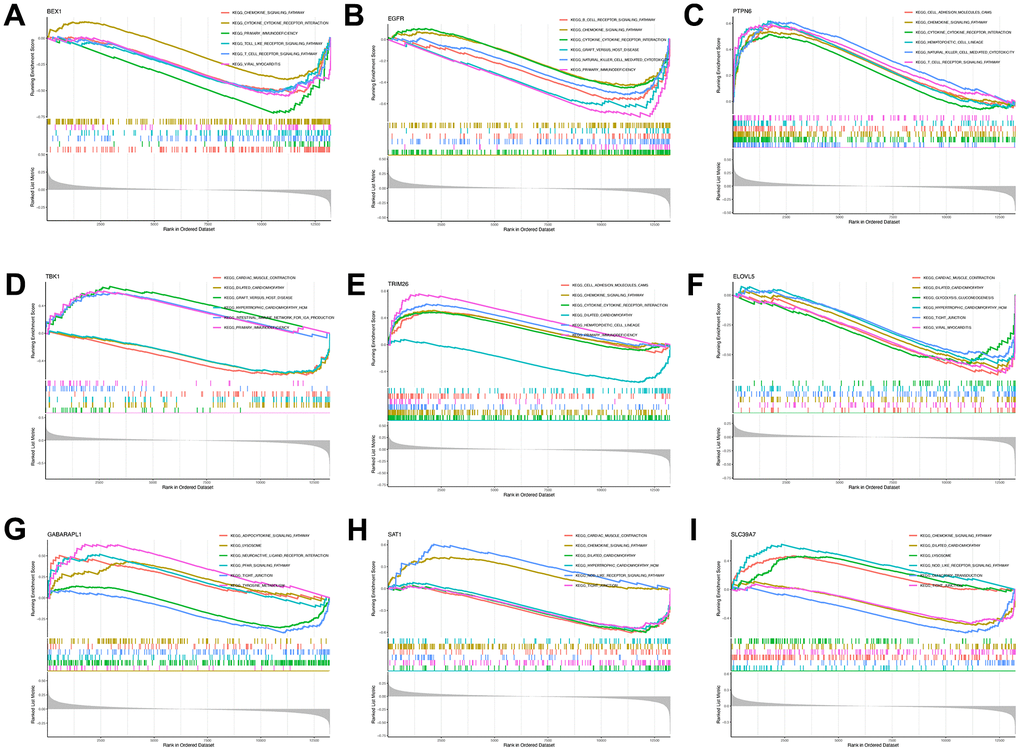
Figure 5.
Single-gene GSEA-KEGG pathway analysis.
BEX1 (
A
), EGFR (
B
), PTPN6 (
C
), TBK1 (
D
), TR1M26 (
E
), ELOVL5 (
F
), GABARAPL1 (
G
), SAT1 (
H
) and SLC39A7 (
I
).