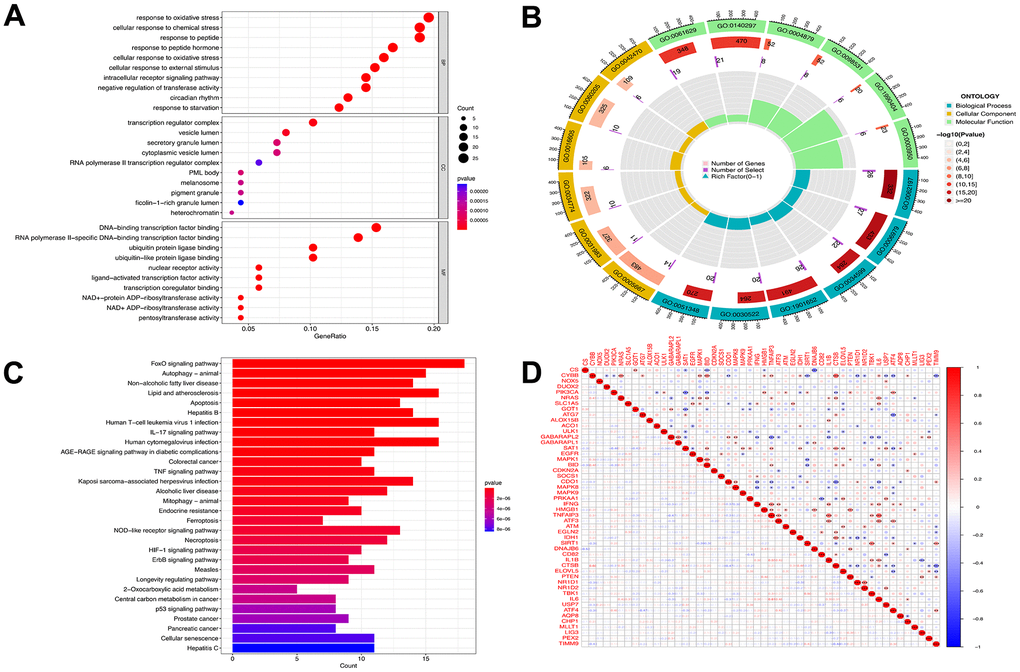
Figure 3.Functional analyses for the DE-FRGs. Bubble plot (A) of functional enrichment analysis including molecular functions (MF), cellular components (CC), and biological processes (BP), and circle plot (B) display. Results of the KEGG pathway analyses of the DE-FRGs with barplot (C). Differential genes correlation heat maps (D) plotted using the corrplot package, we found GABARAPL2 had a negative correlation with TNFAIP3, IL1B, TBK1, and IL6. TNFAIP3 was positively correlated with ATF3, IL1B, TBK1 and IL6. Blue represents a negative correlation, and red represents a positive correlation.