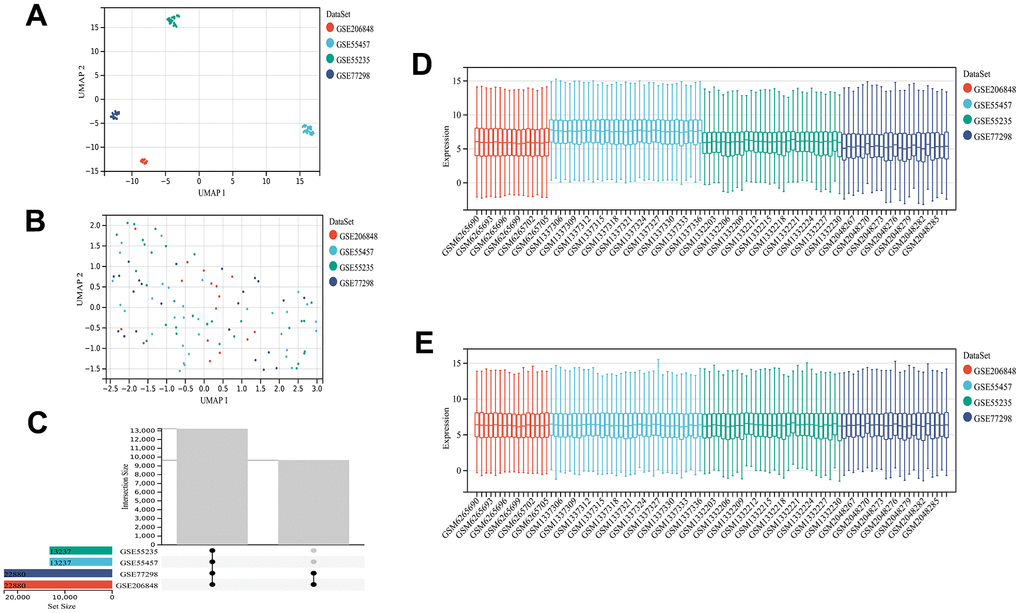
Figure 1.Dataset information and merging. UMAP plot before de-batching effect (A) and UMAP diagram after de-batching (B). Sample content of each dataset (C). Box plot before (D) and after removing the batch effect (E). The data distribution tends to be consistent among the data sets after removing the batch effect, and the median is on a line. The samples of each dataset after removing the batch effect are clustered and intertwined with each other, suggesting a better removal of the batch effect.