Submit an Article
Navigate
Home
Editorial Board
Editorial Policies
Current Volume
Archive
Scientific Integrity
Publication Ethics Statements
Interviews with Outstanding Authors
Newsroom
Sponsored Conferences
Podcast
Contact
Special Collections
Submit an Article
Online ISSN: 1945-4589
Research Paper
|
Volume 16, Issue 11
|
pp. 9386–9409
LASSO regression and WGCNA-based telomerase-associated lncRNA signaling predicts clear cell renal cell carcinoma prognosis and immunotherapy response
Back to article
Figure 9
(9 of 12)
−
100%
+
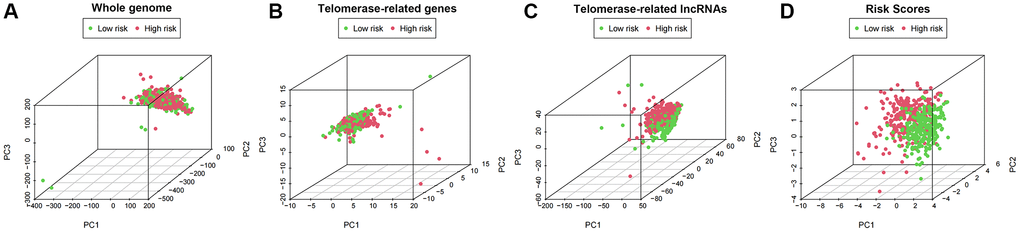
Figure 9.
PCA profiles showed patient distribution based on (
A
) Genome-wide; (
B
) Telomerase-related genes; (
C
) Telomerase-related lncRNAs; and (
D
) Risk score. In the high- and low-risk groups, red and green dots were more strongly separated.