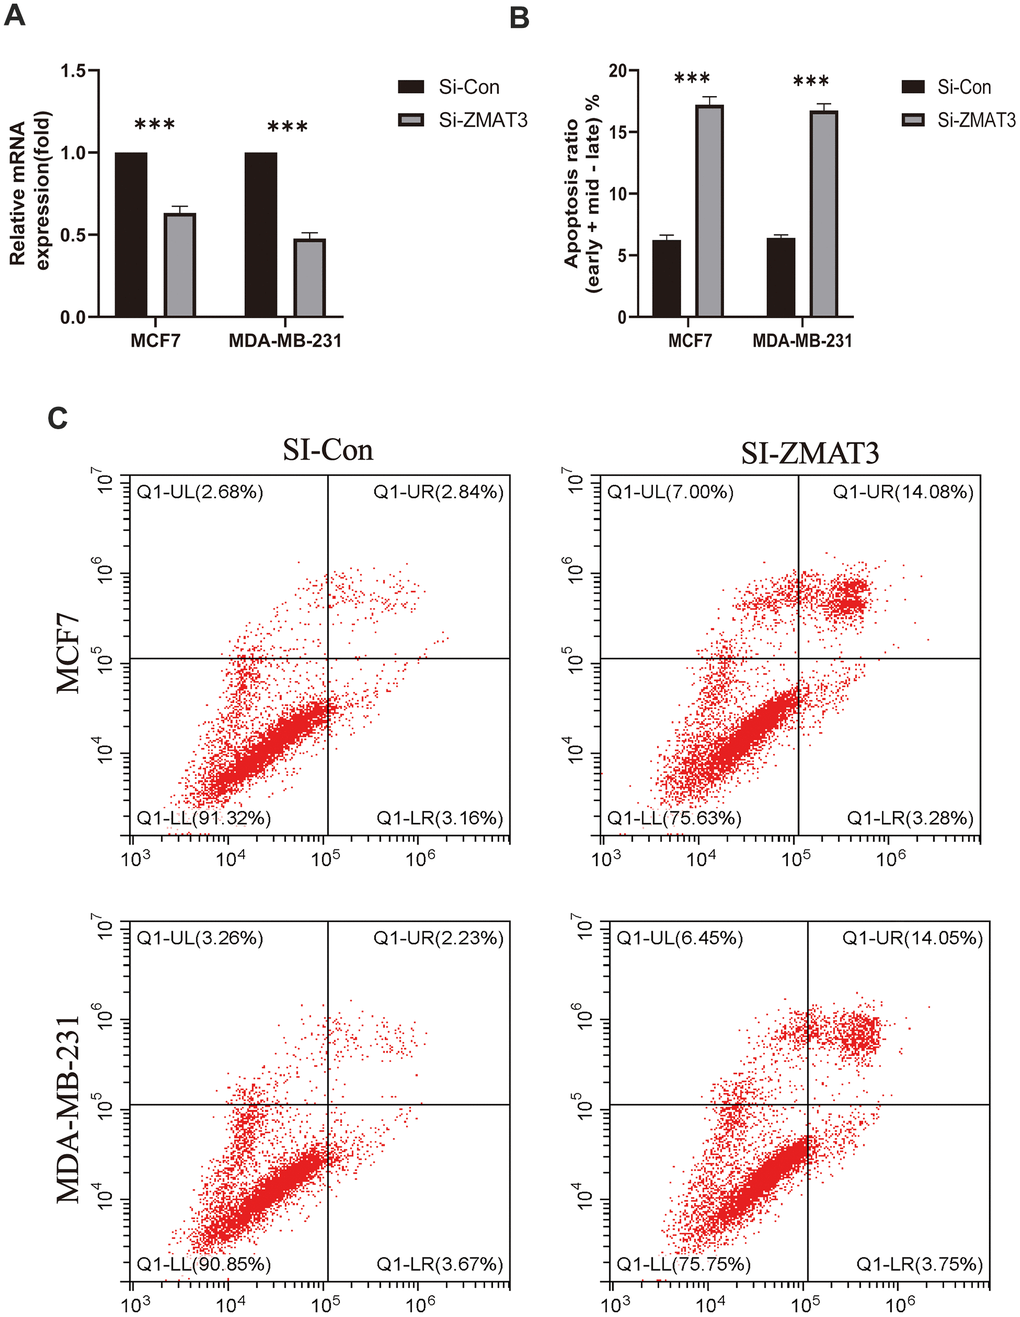
Figure 11.(A) qPCR was used to detect ZMAT3 expression. (B) Apoptosis ratio (early/late) % of each group. (C) Results of flow cytometry for each group.
Figure 11 — Breast cancer clinical outcomes and tumor immune microenvironment: cross-dialogue of multiple epigenetic modification profiles | Aging