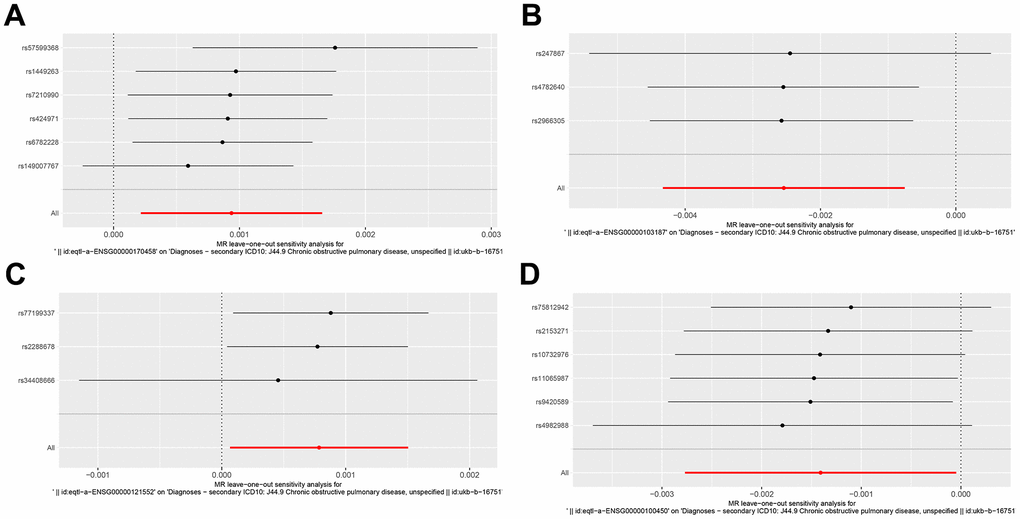
Figure 3.Forest plot of key genes corresponding to SNPs tested by leave-one-out analysis. (A–D) Respectively represented by the genes CD14, COTL1, CSTA and GZMH.
Figure 3 — Potential marker genes for chronic obstructive pulmonary disease revealed based on single-cell sequencing and Mendelian randomization analysis | Aging