Submit an Article
Navigate
Home
Editorial Board
Editorial Policies
Current Volume
Archive
Scientific Integrity
Publication Ethics Statements
Interviews with Outstanding Authors
Newsroom
Sponsored Conferences
Podcast
Contact
Special Collections
Submit an Article
Online ISSN: 1945-4589
Research Paper
|
Volume 16, Issue 10
|
pp. 8810–8821
Systemic immune-inflammation index upon admission correlates to post-stroke cognitive impairment in patients with acute ischemic stroke
Back to article
Figure 2
(2 of 6)
−
100%
+
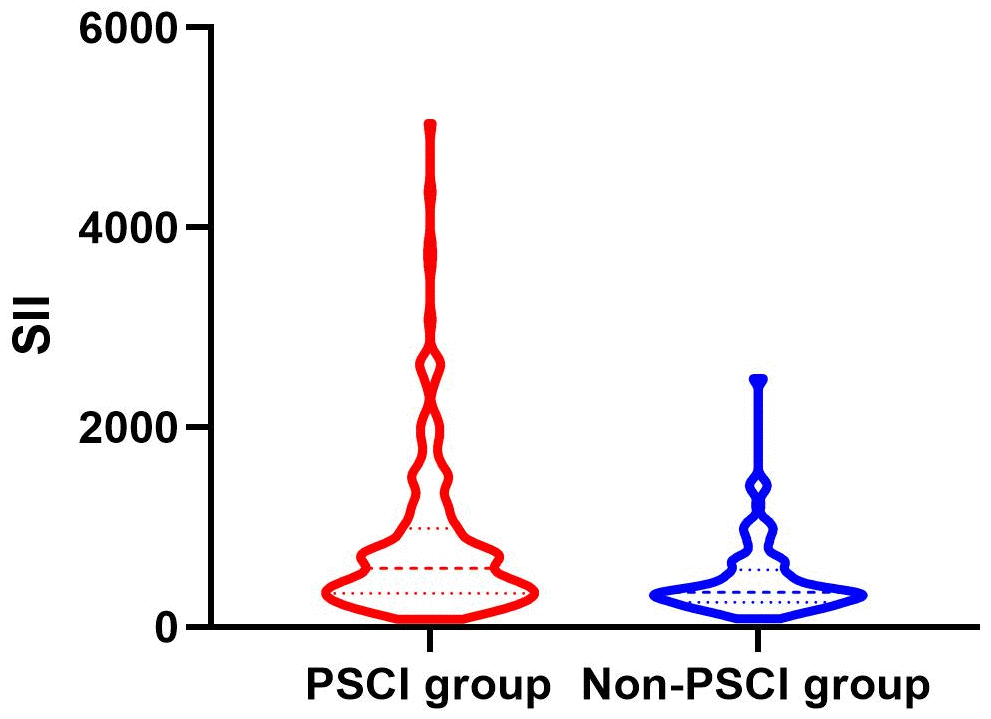
Figure 2.
Violin plot about the distribution of SII and SIRI in the PSCI and nonPSCI subgroups.