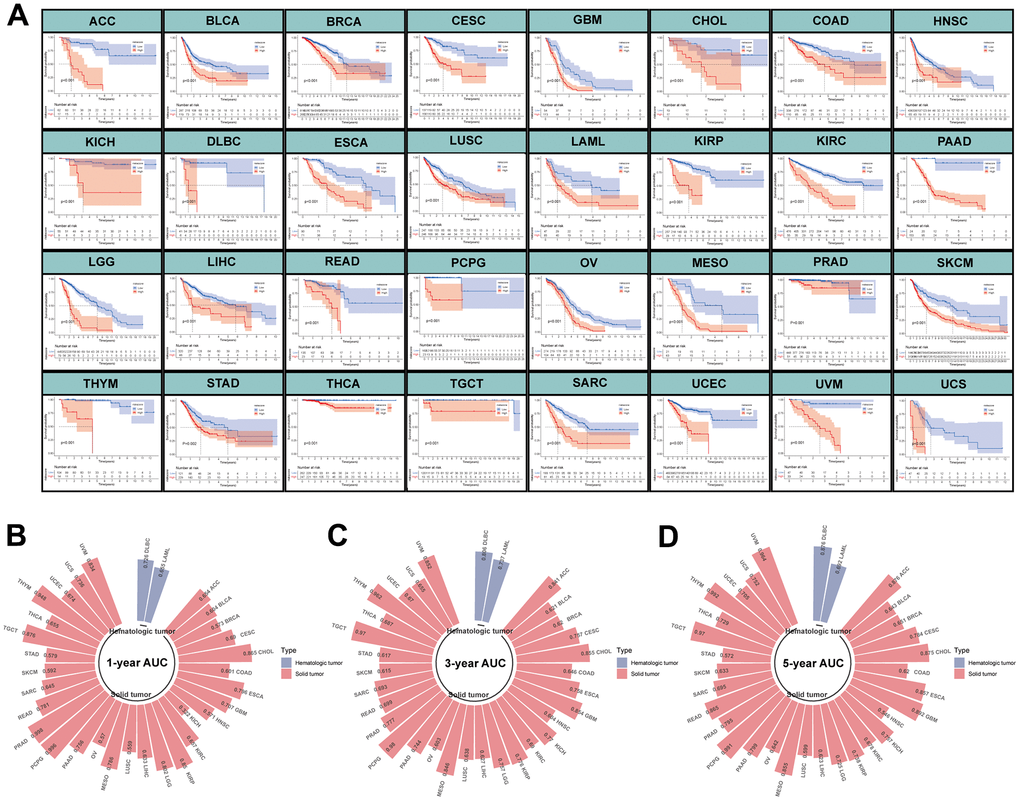
Figure 5.Evaluation of MPPS model in pan-cancer. (A) The Kaplan-Meier analysis of the high- and low-risk groups across 32 tumors in TCGA database except LUAD. The survival analysis was tested by log-rank test. (B–D) The 1-, 3-, 5-year AUC of MPPS model across 32 tumors in TCGA database except LUAD.