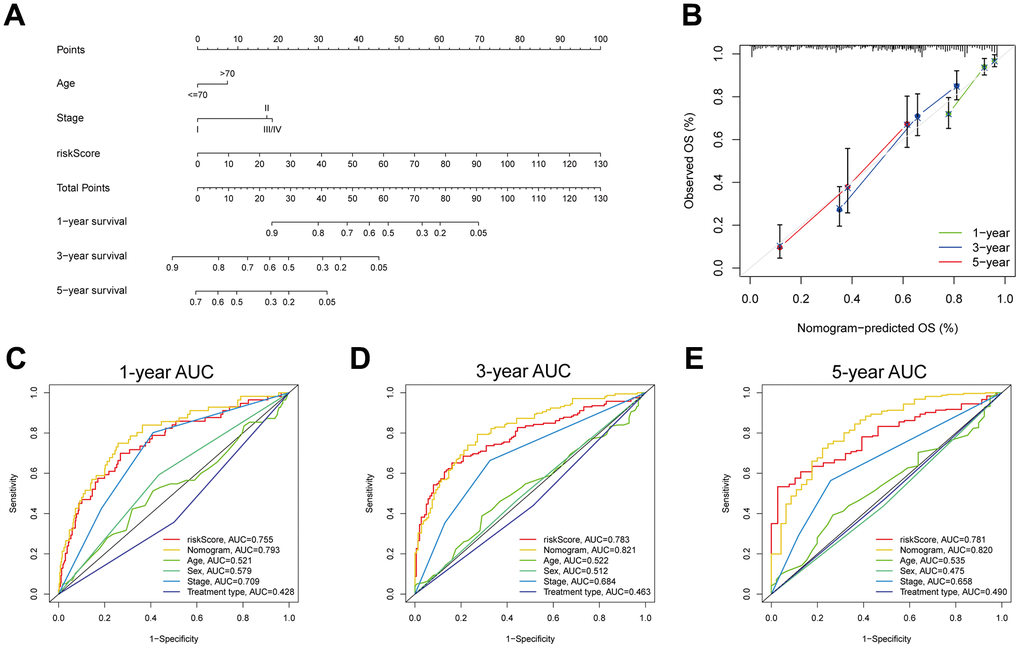
Figure 10.Development and evaluation of a prognostic nomogram. (A) Nomogram composed of MPPS, age, stage to predict 1-, 3-, 5-year OS probability. (B) Calibration curves of 1-, 3-, 5-year OS by nomogram. 1- (C), 3- (D), 5- (E) year ROC curves of MPPS, nomogram, age, sex, stage, and treatment type.