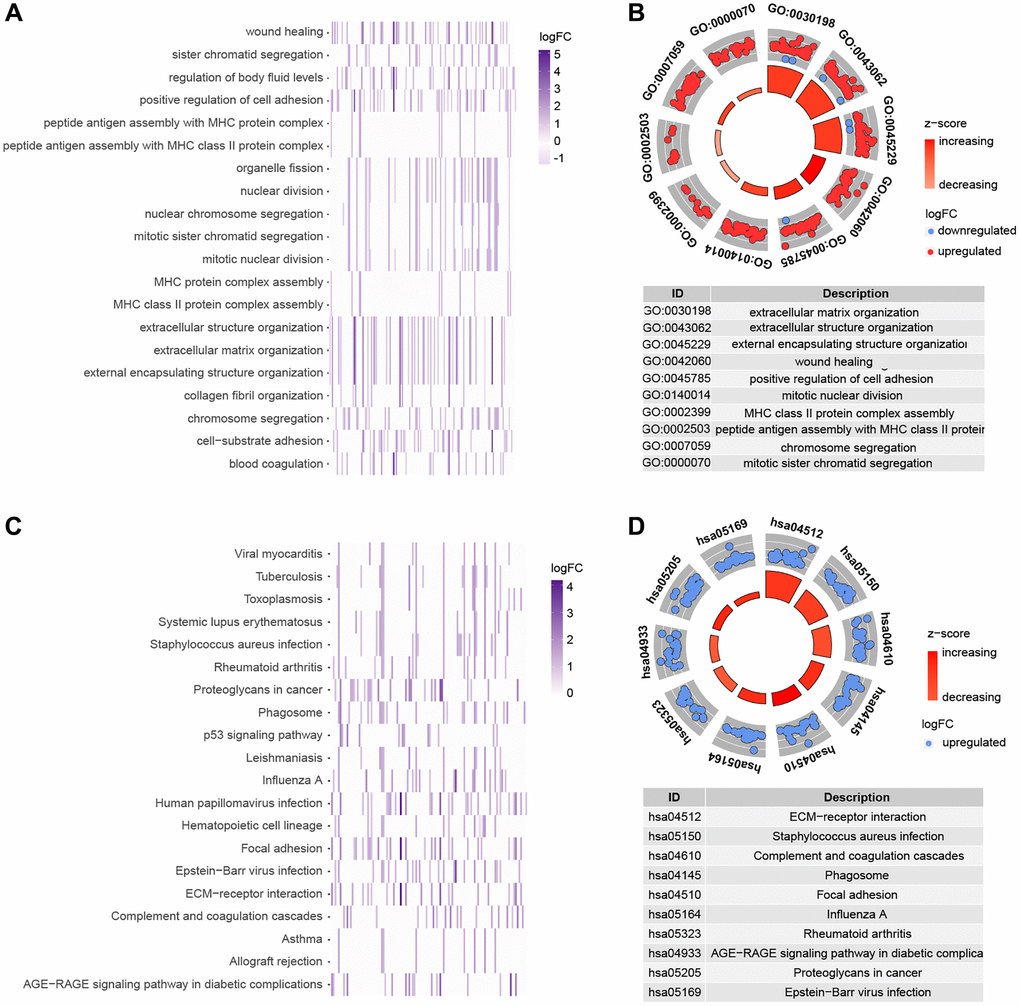
Figure 7.Functional analysis of genes that are differently expressed in high and low risk groups. (A, B) GO enrichment analysis. (C, D) KEGG enrichment analysis.
Figure 7 — A cuproptosis-based prognostic model for predicting survival in low-grade glioma | Aging