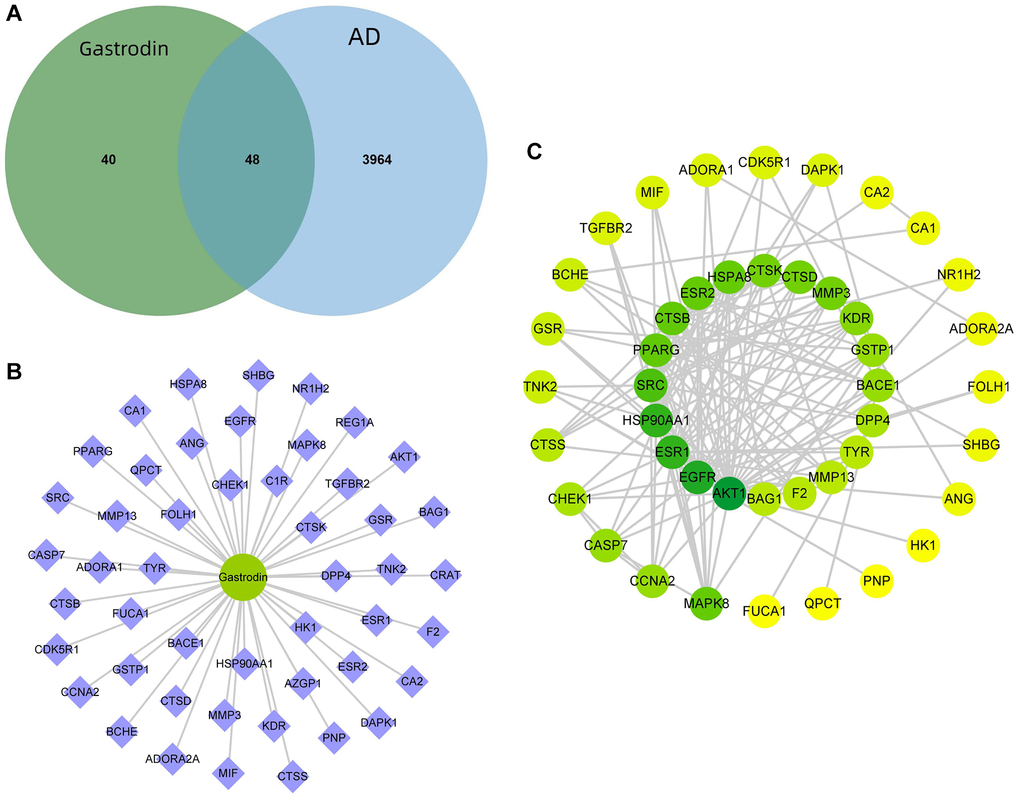
Figure 1.Prediction of GAS–AD interaction targets. (A) There were 48 GAS–AD intersection targets. (B) Drug–component–target network diagram. (C) PPI network.
Figure 1 — Gastrodin ameliorates neuroinflammation in Alzheimer’s disease mice by inhibiting NF-κB signaling activation via PPARγ stimulation | Aging