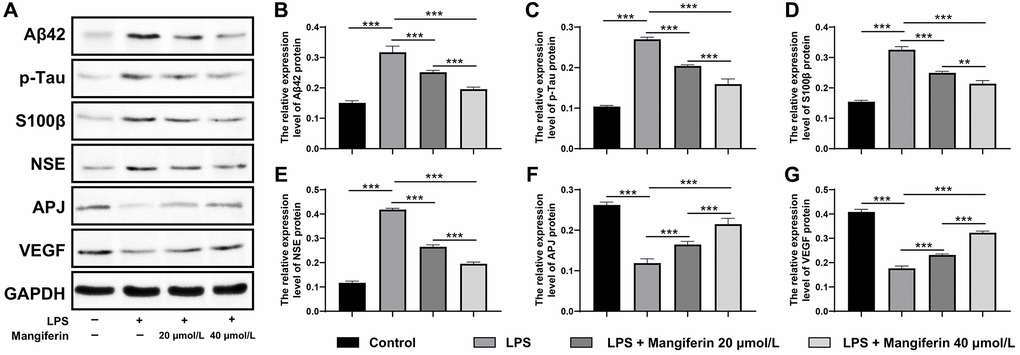
Figure 9.Mangiferin eliminates pathogenic proteins and elevates neuroprotective factors in LPS-challenged cells by Western blot. (A) Western blot showed the protein level of Aβ42, p-tau, S100β, NSE, APJ, and VEGF change with different treatments. (B–G) Quantitative analysis of A, protein levels of Aβ42 in LPS, 20 μmol/L mangiferin with LPS, 40 μmol/L mangiferin with LPS compared to control were 2.10, 1.67, and 1.30 times, respectively, all ***P < 0.001. One-way ANOVA, F = 111.7, ***P < 0.001. Protein levels of p-tau in LPS, 20 μmol/L mangiferin with LPS, 40 μmol/L mangiferin with LPS compared to the control are 2.60, 1.94, and 1.53 times, respectively, all ***P < 0.001. One-way ANOVA, F = 285.7, ***P < 0.001. Protein levels of S100β in LPS, 20 μmol/L mangiferin with LPS, and 40 μmol/L mangiferin with LPS compared to the control are 2.11, 1.61, and 1.38 times, respectively, **P = 0.0026 for 20 μmol/L mangiferin with LPS vs. 40 μmol/L mangiferin with LPS. One-way ANOVA, F = 241.0, ***P < 0.001. Protein levels of NSE in LPS, 20 μmol/L mangiferin with LPS, 40 μM mangiferin with LPS compared to the control are 3.57, 2.27, and 1.67 times, respectively, all ***P < 0.001. One-way ANOVA, F = 990.9, ***P < 0.001. Protein levels of APJ in LPS, 20 μmol/L mangiferin with LPS, 40 μmol/L mangiferin with LPS compared to control are 0.45, 0.63, and 0.82 in fold, respectively, **P = 0.0028 for LPS vs. 20 μmol/L mangiferin with LPS, **P = 0.0015 for 20 μmol/L mangiferin with LPS vs. 40 μmol/L mangiferin with LPS. One-way ANOVA, F = 108.3, ***P < 0.001. Protein levels of VEGF in LPS, 20 μmol/L mangiferin with LPS, 40 μM mangiferin with LPS compared to control were 0.43, 0.57, and 0.79 times, respectively, all ***P < 0.001. One-way ANOVA, F = 467.7, ***P < 0.001.