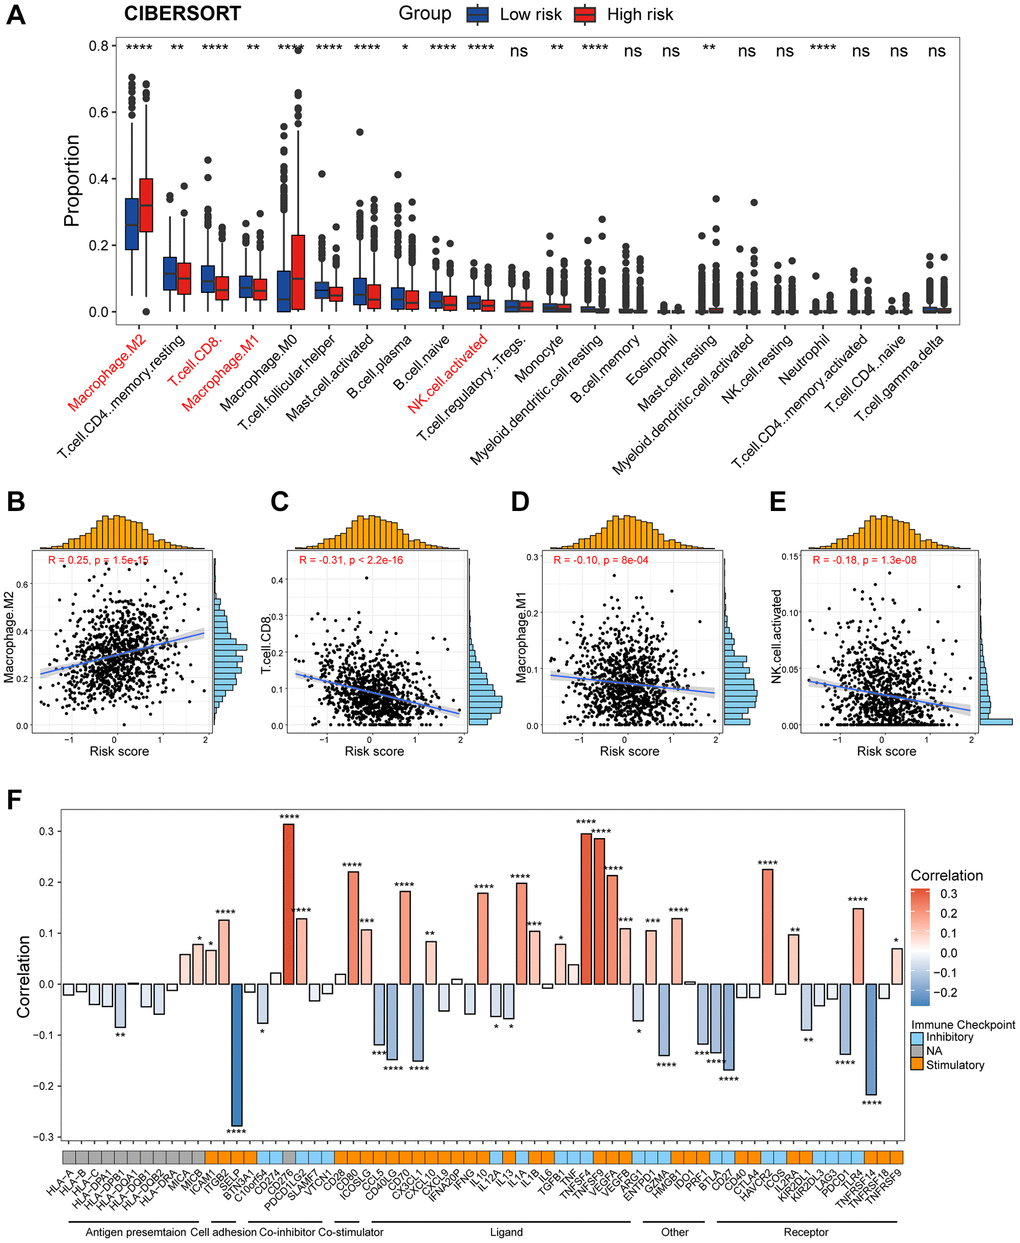
Figure 6.Dissection of tumor immune microenvironment features between high/low-risk group. (A) Boxplots showing the proportion of 22 immune cells in high/low-risk groups of breast cancer estimated by CIBERSORT. Paired two-sided Wilcoxon test. (B–E) Scatter plots showing the correlation between the risk score and the proportion of M2 macrophages, CD8+ T cells, M1 macrophages, and activated NK cells. (F) Bar plot of the correlation between immunomodulators and the risk score in TCGA cohort. The asterisks represent the statistical P-value (*p < 0.05; **p < 0.01; ***p < 0.001; ****p < 0.0001; nsp > 0.05).