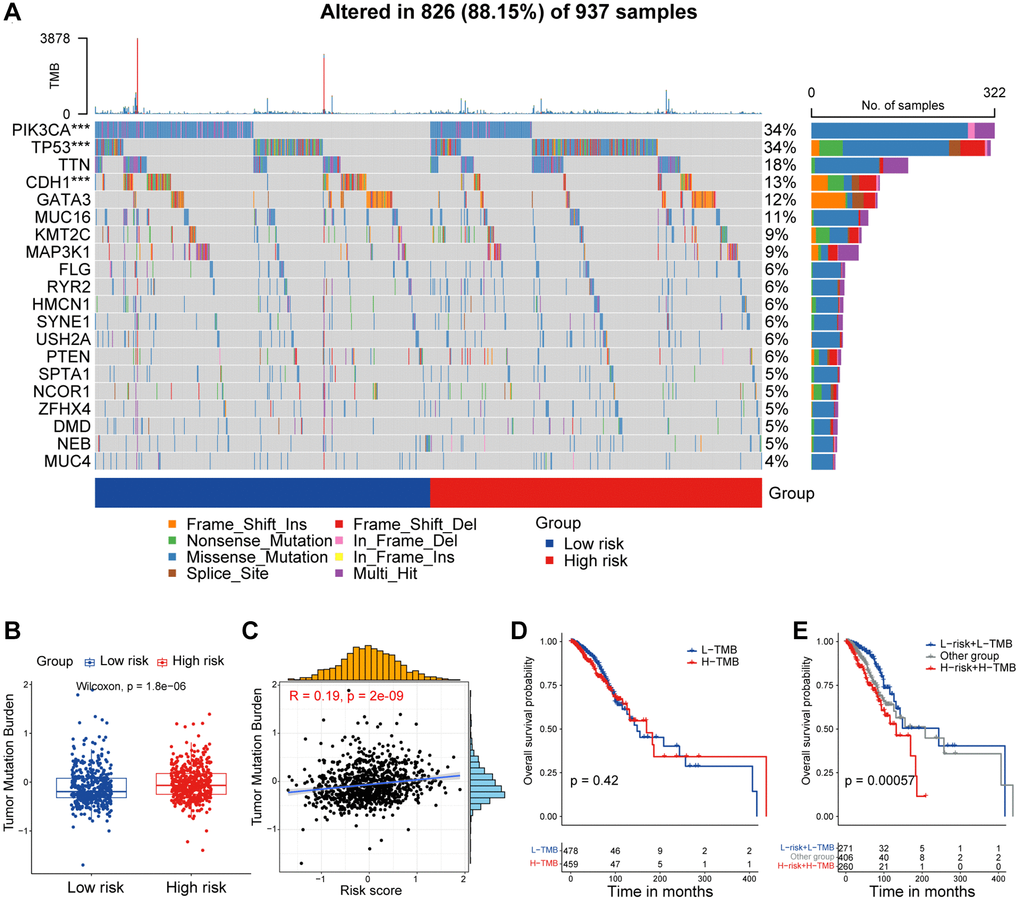
Figure 5.Mutational feature of the CAF-related prognostic signature. (A) Waterfall plot represents the mutation distribution of the most frequently mutated genes in high/low-risk groups. (B) Boxplot showing the levels of TMB in high/low-risk groups. Paired two-sided Wilcoxon test. (C) Scatter plot showing the correlation between the risk score and TMB in TCGA cohort. (D) Kaplan-Meier survival analysis was performed on the relationship between TMB and OS. (E) Kaplan-Meier survival analysis was performed on the relationship between combination of TMB and the risk score and OS. The asterisks represent the statistical P-value (*p < 0.05; **p < 0.01; ***p < 0.001; ****p < 0.0001).