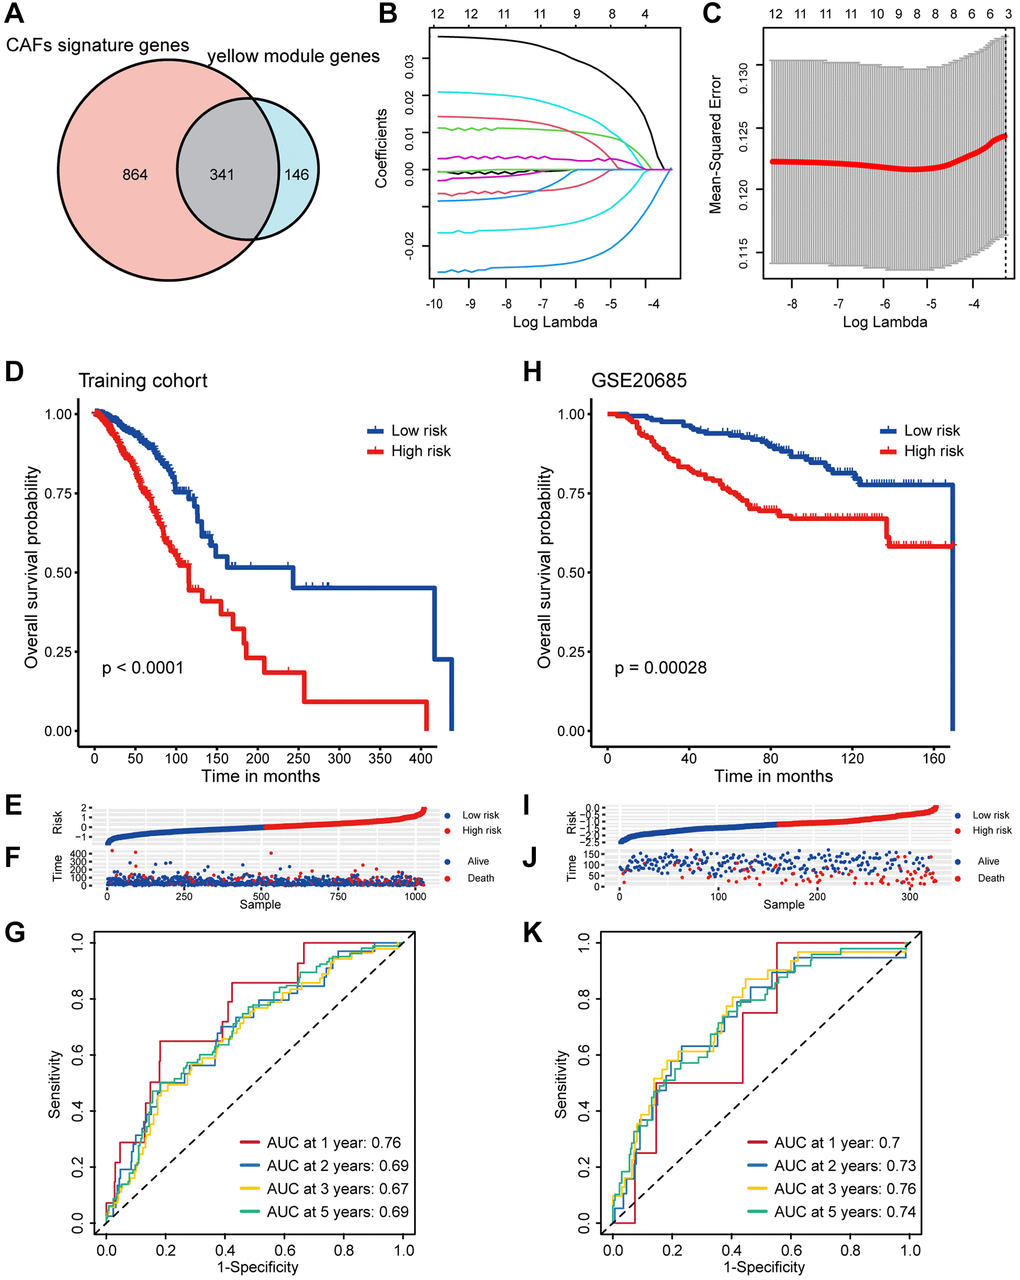
Figure 3.Screening of CAF-related genes and construction a CAF-related prognostic signature in breast cancer. (A) The Venn graph of the CAF signature genes and yellow module genes. (B) Coefficient profiles in the LASSO regression model. (C) Cross-validation for tuning parameter selection in the LASSO regression. (D) Kaplan-Meier survival analysis was performed on the relationship between the risk score and OS using the TCGA training cohort. (E) The rank of risk score in the TCGA training cohort. (F) Survival status in the TCGA training cohort. (G) Time-dependent ROC curve analysis of the prognostic model (1, 2, 3, and 5 years) in the TCGA training cohort. (H) Kaplan-Meier survival analysis was performed on the relationship between the risk score and OS using the GSE20685 validation cohort. (I) The rank of risk score in the GSE20685 validation cohort. (J) Survival status in the GSE20685 validation cohort. (K) Time-dependent ROC curve analysis of the prognostic model (1, 2, 3, and 5 years) in the GSE20685 validation cohort.