Submit an Article
Navigate
Home
Editorial Board
Editorial Policies
Current Volume
Archive
Scientific Integrity
Publication Ethics Statements
Interviews with Outstanding Authors
Newsroom
Sponsored Conferences
Podcast
Contact
Special Collections
Submit an Article
Online ISSN: 1945-4589
Research Paper
|
Volume 16, Issue 8
|
pp. 7357–7386
Heart failure potentially affects the cortical structure of the brain
Back to article
Figure 2
(2 of 9)
−
100%
+
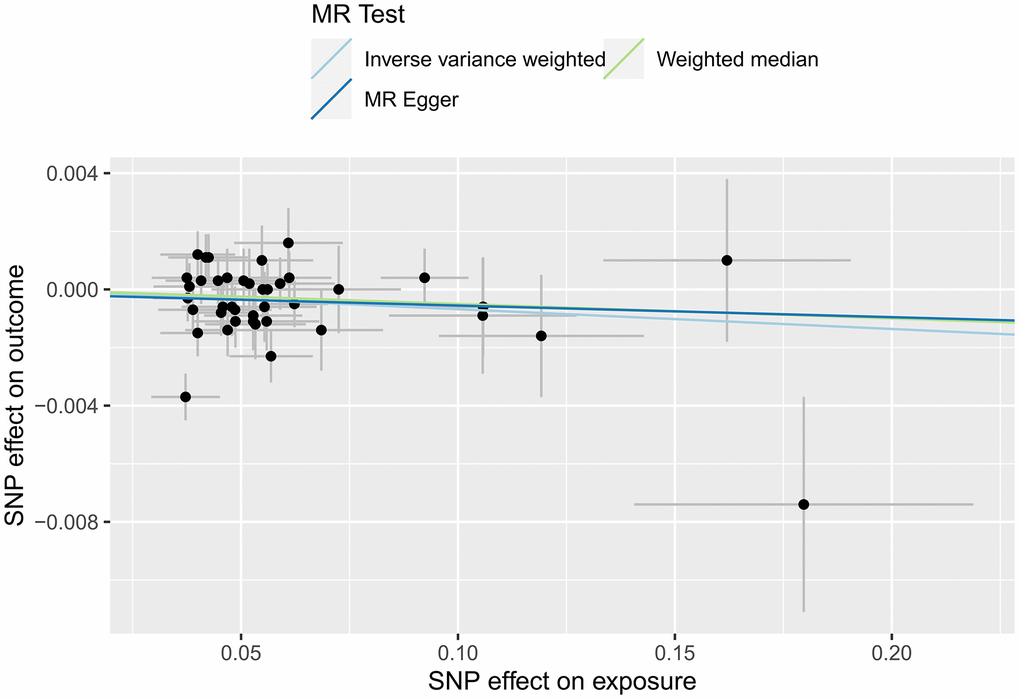
Figure 2.
MR scatter plot of cortical thickness in HF patients.
Figure 2 — Heart failure potentially affects the cortical structure of the brain | Aging