Submit an Article
Navigate
Home
Editorial Board
Editorial Policies
Current Volume
Archive
Scientific Integrity
Publication Ethics Statements
Interviews with Outstanding Authors
Newsroom
Sponsored Conferences
Podcast
Contact
Special Collections
Submit an Article
Online ISSN: 1945-4589
Research Paper
|
Volume 16, Issue 8
|
pp. 7249–7266
AAT resistance-related AC007405.2 and AL354989.1 as novel diagnostic and prognostic markers in prostate cancer
Back to article
Figure 5
(5 of 10)
−
100%
+
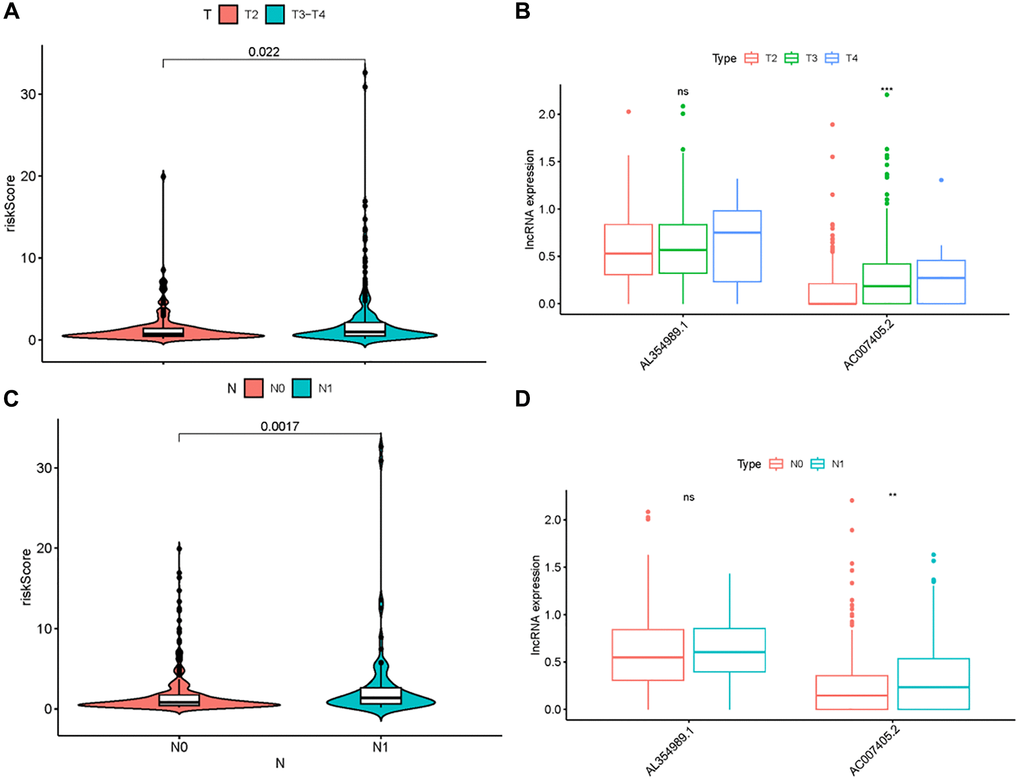
Figure 5.
Clinical correlation analysis of ARR-RSM, AL354989.1 and AC007405.2.
The relations between the expression levels of risk score, AL354989.1 and AC007405.2 with T-stage (
A
,
B
) and
N
-stage (
C
,
D
).