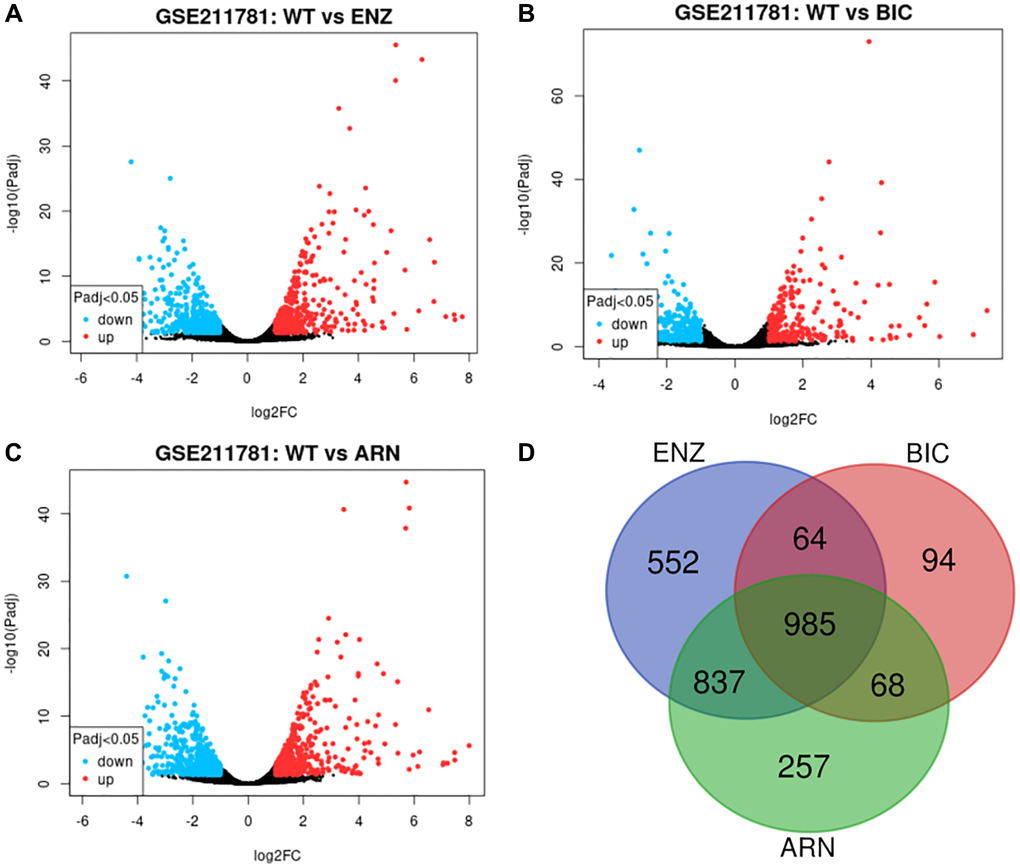
Figure 1.AAT resistance-related gene selected from GSE211781 dataset. The differentially expressed genes between ENZ resistance (A), BIC resistance (B), ARN resistance (C) and WT LNCap cell, log2|FC|≥1, P < 0.05. Venn diagram showed the intersection genes of these differentially expressed genes (D).