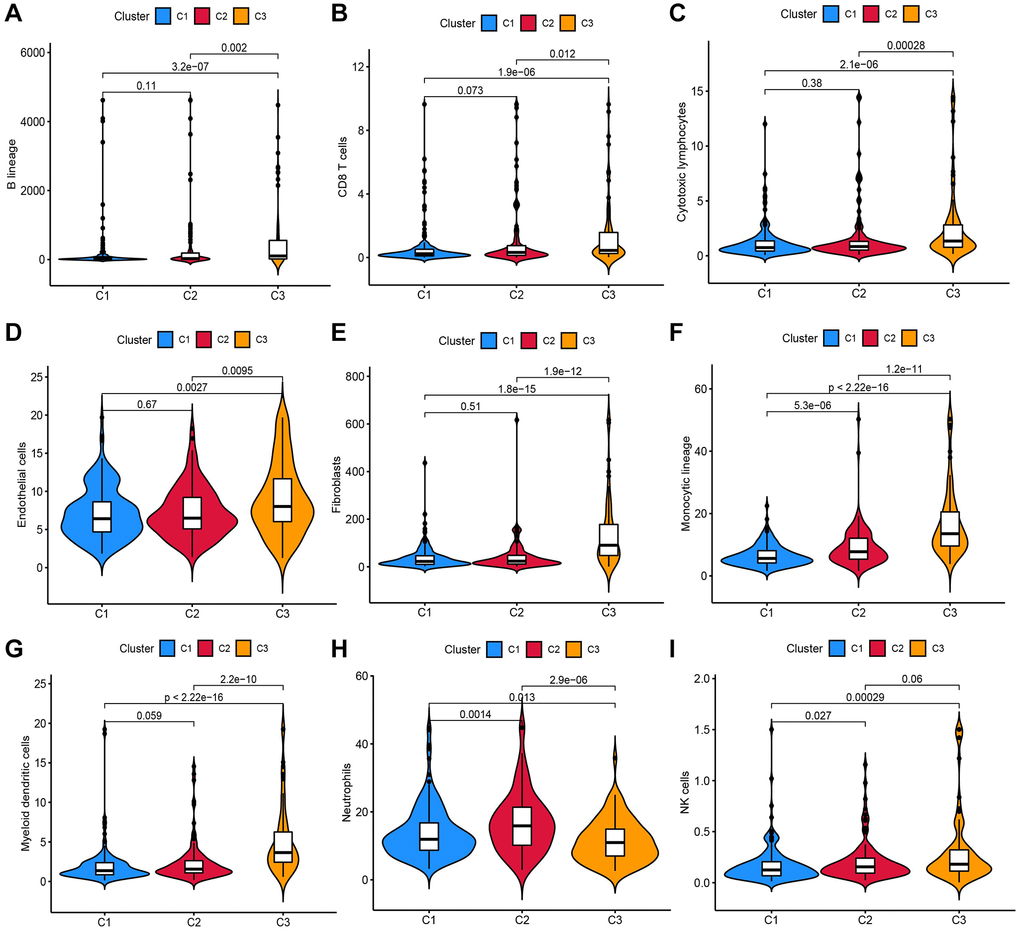
Figure 2.Analysis of the infiltration scores of (A) B lineage, (B) CD8+ T cells, (C) cytotoxic lymphocytes, (D) endothelial cells, (E) fibroblasts, (F) monocytic lineage, (G) myeloid DCs, (H) neutrophils and (I) NK cells in patients in these three molecular subtypes.