Submit an Article
Navigate
Home
Editorial Board
Editorial Policies
Current Volume
Archive
Scientific Integrity
Publication Ethics Statements
Interviews with Outstanding Authors
Newsroom
Sponsored Conferences
Podcast
Contact
Special Collections
Submit an Article
Online ISSN: 1945-4589
Research Paper
|
Volume 16, Issue 7
|
pp. 6455–6477
Machine learning for identifying tumor stemness genes and developing prognostic model in gastric cancer
Back to article
Figure 8
(8 of 15)
−
100%
+
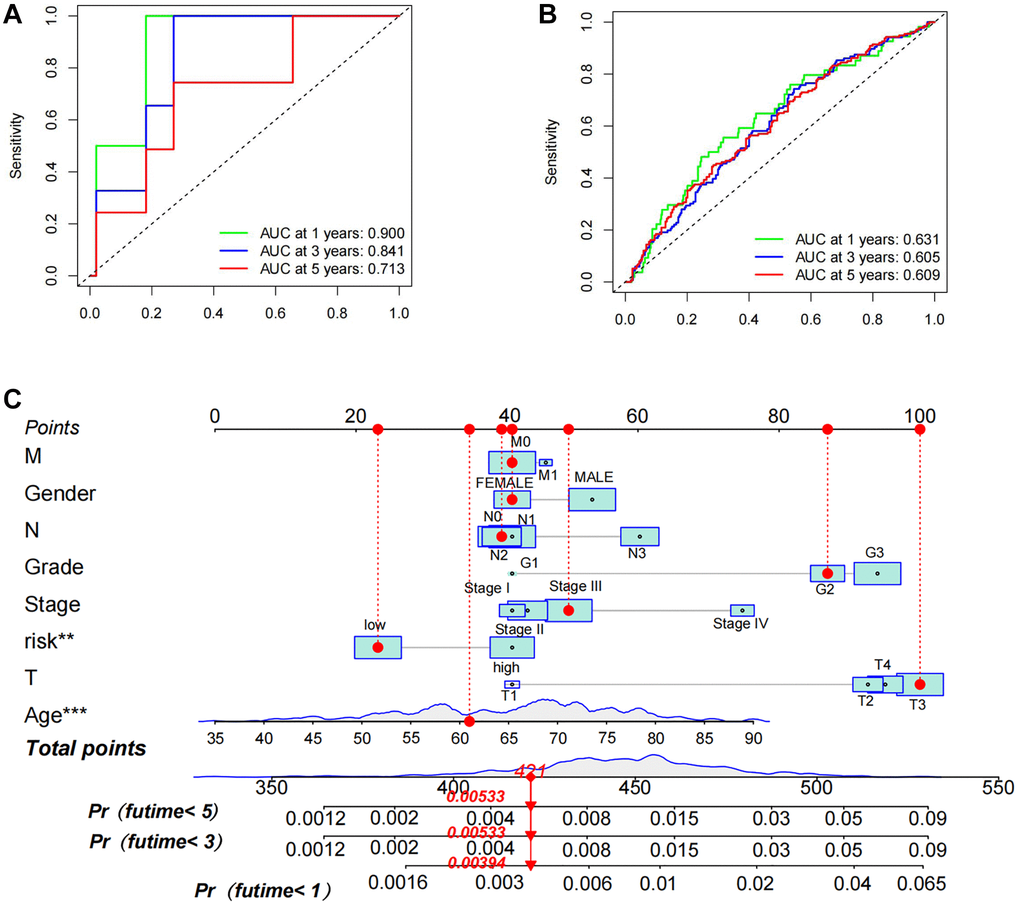
Figure 8.
Assessment of prognostic accuracy of TSRS as well as nomogram construction.
(
A
) ROC curve analysis in TCGA. (
B
) ROC curve analysis in GEO. (
C
) A nomogram constructed using TSRS and other parameters.